Splunk is a powerful platform that enables organizations to gain insights from machine data generated by their applications, systems, and infrastructure. In a DevOps context, Splunk is a critical tool for monitoring, analyzing, and visualizing data to support continuous integration, continuous delivery (CI/CD), and automated workflows. It offers a suite of capabilities for monitoring application performance, tracking logs, identifying security issues, and improving collaboration across teams.
In this post, we will explore the key DevOps features of Splunk, outlining how it supports the various stages of the DevOps lifecycle and contributes to more efficient software development, faster issue resolution, and greater system reliability.
1. Real-Time Monitoring and Alerts
Major Features:
- Real-Time Data Collection:
- Splunk collects machine-generated data from applications, servers, and networks in real time. This allows DevOps teams to monitor system health, application performance, and infrastructure metrics continuously.
- Proactive Alerts:
- With Splunk’s alerting capabilities, teams can set thresholds for specific metrics or events. When thresholds are breached, Splunk triggers automated alerts, helping teams to respond to issues such as system slowdowns, application failures, or security breaches before they impact end users.
- Customizable Dashboards:
- Splunk provides customizable dashboards that offer real-time insights into application and system performance. These dashboards are tailored to monitor specific KPIs, making it easy for DevOps teams to track the health of different systems across the DevOps pipeline.
- Incident Management Integration:
- Splunk can integrate with incident management tools like PagerDuty and ServiceNow to create tickets and escalate alerts, streamlining the issue resolution process and reducing downtime.
2. Log Aggregation and Centralized Logging
Major Features:
- Unified Log Management:
- Splunk aggregates logs from different sources such as servers, applications, databases, and network devices, providing a unified view of all system activity. This centralized log management helps DevOps teams quickly search, analyze, and correlate logs to diagnose and resolve issues.
- Log Search and Analysis:
- The Splunk platform offers advanced search capabilities, enabling teams to quickly sift through vast amounts of log data to identify anomalies, errors, and patterns that may require attention.
- Efficient Troubleshooting:
- By centralizing logs in one location, Splunk simplifies the troubleshooting process. DevOps teams can trace issues back to their root cause by analyzing logs across different environments and services.
- Historical Data Retention:
- Splunk allows for the retention of logs over time, providing historical data that can be used for audits, performance analysis, and trend forecasting. This long-term data storage is essential for identifying recurring issues or predicting potential future problems.
3. Performance Metrics and Application Monitoring
Major Features:
- Application Performance Monitoring (APM):
- Splunk provides APM capabilities that allow DevOps teams to track the performance of applications in real-time. This includes monitoring response times, error rates, transaction traces, and system resource utilization.
- End-to-End Visibility:
- Splunk offers visibility across the entire application stack, from the front-end user experience to the back-end infrastructure. This ensures that DevOps teams have a comprehensive understanding of how applications perform and how issues in one part of the system may affect others.
- Infrastructure Health Monitoring:
- Splunk collects data from cloud environments, on-premise servers, containers, and network devices, giving DevOps teams the ability to monitor the health and resource usage of their infrastructure. This includes metrics like CPU usage, memory utilization, and disk space, helping to ensure system reliability.
- Synthetic Monitoring:
- Splunk supports synthetic monitoring, where automated tests simulate user interactions with the application. This allows DevOps teams to proactively identify performance bottlenecks and issues before they affect real users.
4. Security Information and Event Management (SIEM)
Major Features:
- Security Log Monitoring:
- Splunk’s SIEM capabilities enable organizations to collect, analyze, and monitor security-related logs and events across the DevOps pipeline. This helps teams detect and respond to security threats in real-time, such as unauthorized access attempts, malicious activity, or system vulnerabilities.
- Threat Detection:
- Splunk uses machine learning and anomaly detection to identify potential security threats based on historical data and patterns. By automatically flagging suspicious behavior, DevOps teams can act quickly to mitigate security risks.
- Compliance Reporting:
- Splunk assists organizations with regulatory compliance by providing predefined dashboards and reports tailored to standards such as GDPR, HIPAA, and PCI-DSS. This enables teams to ensure that their systems remain secure and compliant with industry regulations.
- Incident Response Automation:
- With Splunk, security incidents can trigger automated responses, such as blocking IP addresses, revoking user access, or notifying the security team. This helps reduce the time it takes to respond to and mitigate potential security threats.
5. Automation and Integration
Major Features:
- CI/CD Integration:
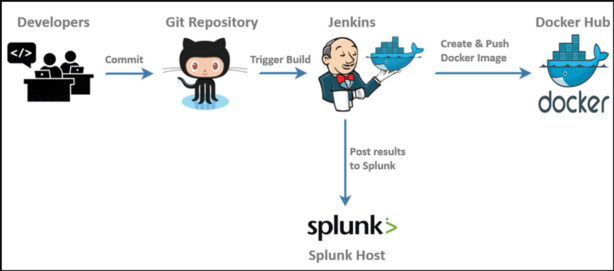
- Splunk integrates with popular CI/CD tools like Jenkins, GitLab, and CircleCI to provide visibility into the software development pipeline. This integration allows DevOps teams to monitor build and deployment processes, track changes, and troubleshoot any issues that arise during code integration or release.
- Automated Workflows:
- Splunk integrates with workflow automation tools such as Ansible, Chef, and Puppet, allowing DevOps teams to automate configuration management and infrastructure provisioning. By automating these processes, teams reduce manual intervention and increase operational efficiency.
- API Access for Customization:
- Splunk offers robust APIs that allow DevOps teams to integrate with other third-party tools, extend functionality, and automate custom workflows. This flexibility ensures that Splunk can be integrated into any DevOps environment, regardless of the tools and services used.
- Collaboration Features:
- Splunk allows teams to share alerts, logs, and dashboards in real time, fostering better collaboration between developers, operations, and security teams. This ensures that everyone has access to the same insights and can work together to resolve issues quickly.
6. Data Analytics and Reporting
Major Features:
- Advanced Data Analytics:
- Splunk provides powerful analytics capabilities that help DevOps teams analyze and interpret vast amounts of machine data. Using Splunk’s Search Processing Language (SPL), teams can perform complex queries to extract actionable insights from log files, metrics, and other sources.
- Custom Dashboards:
- DevOps teams can create custom dashboards to visualize key performance indicators (KPIs), system health, and application metrics. These dashboards provide at-a-glance insights into the status of applications, infrastructure, and security, helping teams make informed decisions.
- Predictive Analytics:
- Using machine learning and historical data, Splunk provides predictive analytics capabilities. This allows teams to anticipate performance issues, security threats, and resource shortages before they occur, enabling proactive issue resolution.
- Data Correlation and Visualization:
- Splunk’s analytics tools allow teams to correlate data across different sources, making it easier to identify trends, anomalies, and the impact of changes across the entire system. These visualizations help teams make faster, data-driven decisions.
Conclusion: Splunk’s Role in DevOps
Splunk is an essential tool for modern DevOps practices, providing real-time monitoring, log aggregation, application performance tracking, security event management, and advanced analytics. By integrating Splunk into the DevOps pipeline, teams gain the visibility and insights needed to ensure system reliability, security, and operational efficiency.
With its powerful features for automating workflows, managing incidents, and visualizing performance metrics, Splunk empowers DevOps teams to build, deploy, and maintain software with greater confidence and speed. Whether for security, troubleshooting, or performance optimization, Splunk’s capabilities make it a critical part of any DevOps strategy.
This post outlines the key DevOps features of Splunk, emphasizing its role in enhancing monitoring, automation, security, and data analytics. Let me know if you need further details or adjustments!