Source: infoq.com
VMWare has open-sourced Octant, a tool to help developers understand how their applications are running in a Kubernetes cluster. Developers can graphically visualize Kubernetes objects dependencies, forward local ports to a running pod, inspect pod logs, and navigate through different clusters. Moreover, users can extend Octant’s capabilities by installing or authoring a plugin like adding components to views or highlighting objects deployed recently.
Octant offers developers a dashboard to inspect workloads that are running in a cluster in real-time fashion. The Kubernetes ecosystem already has existing dashboard projects like the official dashboard, Kubernator, Kubernetic, and Kiali if you’re using Istio. But Joe Beda, principal engineer at VMWare, said that they “didn’t conceive Octant as a dashboard but rather as a visual complement to kubectl” when they were developing the tool.

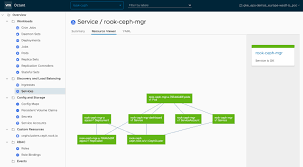
Users can explore Kubernetes objects like cron jobs, daemon sets, deployments, jobs, pods, or services. Moreover, Octant offers a resource graph so that users can see object status and how objects depend on each other. For instance, which objects belong to a service or ingress object or which service account a pod is using.

Octant is a client-side tool, meaning that users don’t have to install anything in the cluster to start using it. Because Octant runs locally, it uses the developer’s local credentials and permissions to query objects in the cluster. Kubernetes administrators don’t have to worry about giving extra permissions to users. Additionally, for developers who have to interact with different clusters, Octant supports multiple kubeconfig files. Users can switch context between different clusters or namespaces with the click of a button instead of running two or three kubectl commands.
Another feature in Octant is the ability to forward a local port to a running pod and connect to it. Instead of running the kubectl port-forward
command, users can start forwarding with a simple click on the Octant’s
dashboard. Additionally, Octant supports the ability to port forward
multiple pods from different namespaces.

Within the same dashboard, users can also read logs from pods and containers in real-time without having to run any kubectl logs command or using multiple terminals to debug different pods or containers at the same time.

Kubernetes API is also extensible through custom resource definitions (CRD), and Octant has support to explore any CRD that is running in the cluster. And because Octant also has a plugin system written in Go, CRD authors can create a plugin to enrich the visibility of custom resources. Octant’s plugin system allows other tools and processes to integrate with the delivery lifecycle for Kubernetes workloads. For instance, a plugin can highlight Kubernetes objects that have been updated after a deployment or release happens. Therefore, users can spot problems more effectively without running several commands in the terminal.
To start using Octant, users have to install the tool in their Linux, Mac, or Windows 10 workstation. For Windows, users can install Octant using chocolatey by running the choco install octant --confirm command or use scoop and run the scoop install octant command. Alternatively, users can download the Linux, Mac, or Windows binaries from the release page, unpack it, and run it. Octant is working on getting it into Homebrew.
Octant’s roadmap includes features like the ability to edit Kubernetes objects with a YAML editor, embed the kubectl command-line in Octant, include a heat-map to help users understand any problems in pods, and an enhanced GUI with more buttons, modals, and alerts.