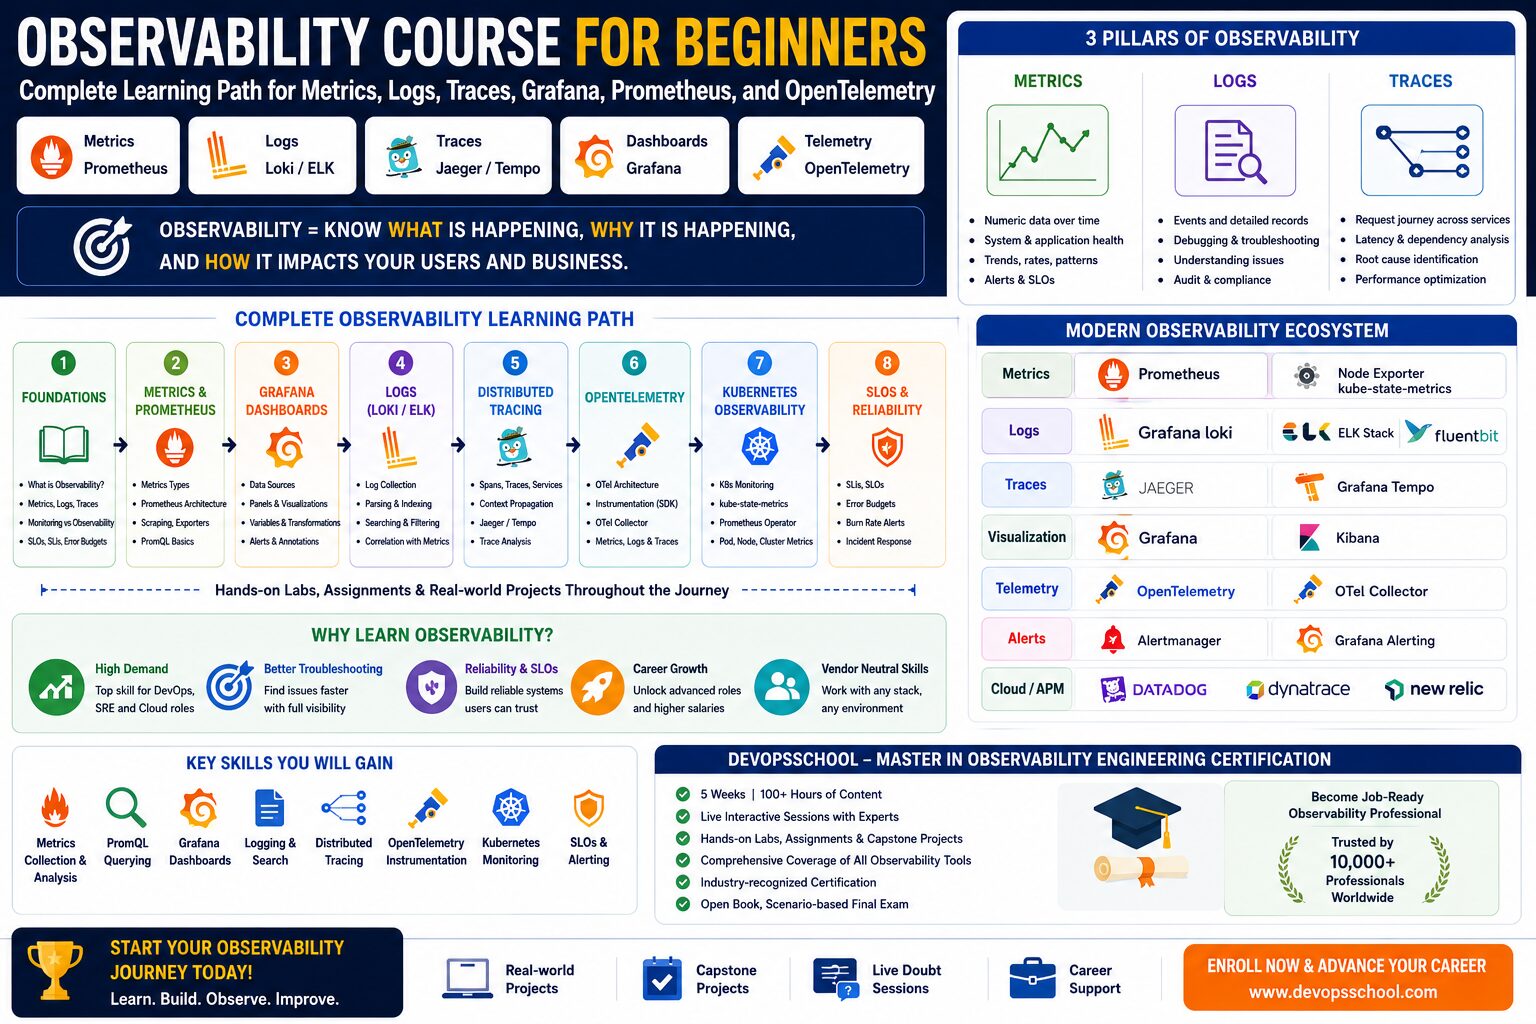
If you are starting your career in DevOps, SRE, cloud engineering, platform engineering, or application support, one skill will keep showing up again and again: observability.
Not just monitoring.
Not just dashboards.
Not just logs.
Real observability.
Modern systems are no longer simple. Applications run across Kubernetes clusters, cloud platforms, microservices, APIs, databases, message queues, containers, serverless components, and third-party services. A single user request may travel through multiple services before returning a response. When something breaks, restarting a server is no longer enough.
Teams need to know:
- What happened?
- Where did it happen?
- Why did it happen?
- Who was affected?
- Which service caused it?
- Did the latest deployment introduce it?
- Are we violating our SLO?
- Should we roll back, scale, or investigate deeper?
That is where observability becomes essential.
An observability course for beginners should help you move from “I can see a dashboard” to “I can understand and debug a production system.”
This guide gives you a complete beginner-friendly learning path for observability. We will cover metrics, logs, traces, Grafana, Prometheus, OpenTelemetry, Kubernetes observability, SLOs, hands-on labs, career paths, certification training, and how DevOpsSchool’s Master in Observability Engineering Certification fits perfectly into this learning journey.
What Is Observability?
Observability is the ability to understand the internal state of a system by analyzing the external signals it produces.
In simple words:
Observability helps you understand what your system is doing and why it is behaving that way.
A production system usually gives you three major signals:
- Metrics
- Logs
- Traces
These are often called the three pillars of observability.
But in real engineering teams, observability also includes:
- Dashboards
- Alerts
- SLOs
- SLIs
- Error budgets
- Incident response
- Root cause analysis
- Application performance monitoring
- Kubernetes monitoring
- Distributed tracing
- Telemetry pipelines
- Runbooks
- Postmortems
- Reliability engineering
A beginner should understand this from day one: observability is not a tool. It is a practice.
Tools such as Prometheus, Grafana, OpenTelemetry, Loki, Tempo, Jaeger, ELK, Datadog, Dynatrace, and New Relic help you implement observability. But the real skill is knowing how to use signals to troubleshoot systems and improve reliability.
Observability vs Monitoring: The First Concept Beginners Must Learn
Monitoring tells you when something is wrong.
Observability helps you understand why something is wrong.
Monitoring usually works well for known problems:
- CPU usage is high
- Disk space is low
- Server is down
- Memory usage crossed a threshold
- Application returned 500 errors
Observability helps with unknown or complex problems:
- A payment request is slow only for one region
- A deployment increased latency for one API endpoint
- A Kubernetes pod is healthy but users still see failures
- A database query is slow only under specific traffic patterns
- A downstream service is creating cascading timeouts
- Logs show errors but the real issue started in another service
Monitoring is still important. You need it.
But monitoring alone is not enough for cloud-native systems.
Observability gives engineers the context needed to debug modern applications.
Why Observability Is Important for Beginners
If you are new to DevOps or SRE, observability may feel like an advanced topic. But it is actually one of the best places to build real production understanding.
Why?
Because observability teaches you how systems behave after deployment.
Many beginners learn Linux, Git, Docker, Kubernetes, Jenkins, Terraform, or cloud platforms. These are excellent skills. But eventually, every engineer faces the same question:
“My application is deployed. Now how do I know if it is working properly?”
Observability answers that question.
It helps beginners understand:
- How applications behave in production
- How infrastructure affects performance
- How errors appear
- How latency spreads
- How Kubernetes workloads fail
- How alerts are designed
- How teams investigate incidents
- How reliability is measured
- How DevOps and SRE teams make decisions
This is why observability is such a valuable career skill.
It connects development, infrastructure, operations, cloud, Kubernetes, monitoring, and reliability into one practical discipline.
Who Should Learn Observability?
Observability is useful for many technical roles.
DevOps Engineers
DevOps engineers need observability to understand what happens after deployment. CI/CD may say a release succeeded, but observability tells you whether production is healthy.
SRE Engineers
SRE engineers use observability to measure reliability, define SLOs, monitor error budgets, respond to incidents, and reduce downtime.
Cloud Engineers
Cloud engineers use observability to monitor cloud infrastructure, managed services, Kubernetes clusters, networking, storage, and application workloads.
Platform Engineers
Platform engineers use observability to build shared monitoring and reliability platforms for development teams.
Developers
Developers use observability to understand how their code performs in production, where errors occur, and which dependencies are slow.
Application Support Engineers
Support engineers use logs, dashboards, traces, and alerts to investigate user issues quickly.
If you work with production systems, observability is not optional anymore.
The Three Pillars of Observability
Let’s understand the foundation.
1. Metrics
Metrics are numerical measurements collected over time.
Examples:
- CPU usage
- Memory usage
- Request count
- Error count
- Request latency
- Disk usage
- Network traffic
- Queue depth
- Pod restart count
- Database query duration
Metrics are excellent for dashboards, trends, alerts, and SLOs.
Metrics answer questions like:
- Is traffic increasing?
- Is latency getting worse?
- Are errors rising?
- Is the service healthy?
- Which pod is consuming memory?
- Are we meeting our SLO?
Prometheus is one of the most popular tools for collecting and querying metrics.
Grafana is commonly used to visualize those metrics.
2. Logs
Logs are event records generated by applications, servers, containers, databases, and infrastructure systems.
Examples:
- Error messages
- Stack traces
- Authentication failures
- API request logs
- Database errors
- Deployment events
- Application warnings
Logs are useful when you need details.
Logs answer questions like:
- What error happened?
- What did the application say before it failed?
- Which user request caused the issue?
- Which exception occurred?
- Which dependency returned an error?
Popular logging tools include ELK, EFK, Grafana Loki, Fluent Bit, and Fluentd.
3. Traces
Traces show the journey of a request across multiple services.
In microservices, one user request may pass through:
- Frontend
- API gateway
- Auth service
- User service
- Payment service
- Inventory service
- Database
- Cache
- Message queue
- Third-party API
A trace shows how much time each part took and where the request failed or slowed down.
Traces answer questions like:
- Which service caused latency?
- Which downstream dependency failed?
- Where did the request spend most of its time?
- Did the problem start upstream or downstream?
- Which database query slowed the request?
Popular tracing tools include Jaeger, Zipkin, Grafana Tempo, and OpenTelemetry.
Complete Observability Learning Path for Beginners
A beginner should not start by installing every observability tool at once.
That creates confusion.
Instead, follow a layered learning path.
Step 1: Learn Observability Foundations
Start with concepts.
Learn:
- Monitoring vs observability
- Metrics, logs, and traces
- Telemetry
- Instrumentation
- Time-series data
- Distributed systems
- Application performance monitoring
- SLIs, SLOs, and error budgets
- Incident response
- Root cause analysis
This foundation matters because tools make sense only when you understand the problems they solve.
A beginner mistake is learning Grafana panels without understanding what should be measured. Avoid that.
First learn why observability matters.
Then learn the tools.
Step 2: Learn Metrics
Metrics are the best starting point because they are easier to visualize and alert on.
Learn:
- Counter
- Gauge
- Histogram
- Summary
- Labels
- Cardinality
- Aggregation
- Rate calculation
- Percentiles
- Time-series storage
Start with basic infrastructure metrics:
- CPU
- Memory
- Disk
- Network
Then move to application metrics:
- Request rate
- Error rate
- Duration
- Active users
- Queue length
- Database query time
A strong beginner should understand two practical models:
RED Method
Useful for services:
- Rate
- Errors
- Duration
USE Method
Useful for infrastructure:
- Utilization
- Saturation
- Errors
These models help you build useful dashboards instead of random charts.
Step 3: Learn Prometheus
Prometheus is one of the most important tools in modern monitoring and observability.
It collects metrics, stores time-series data, supports powerful querying, and integrates beautifully with Grafana.
Beginners should learn:
- Prometheus architecture
- Scrape model
- Targets
- Jobs and instances
- Exporters
- Prometheus configuration
- Prometheus data model
- Labels
- PromQL
- Recording rules
- Alerting rules
- Alertmanager
- Prometheus Operator
- Kubernetes monitoring
PromQL is especially important.
PromQL helps you ask questions like:
- What is the request rate?
- What is the error rate?
- What is p95 latency?
- Which pod is using the most memory?
- Which endpoint is slow?
- Which service is breaching its SLO?
If you want to work in DevOps or SRE, Prometheus is one of the first observability tools you should learn seriously.
Step 4: Learn Grafana
Grafana turns observability data into dashboards, panels, alerts, and operational views.
But Grafana training should not only teach where to click.
A good Grafana learner should know how to design dashboards that help engineers make decisions.
Learn:
- Data sources
- Panels
- Variables
- Transformations
- Dashboards
- Dashboard folders
- Dashboard permissions
- Dashboard provisioning
- Grafana Alerting
- Notification policies
- Annotations
- Dashboard links
- Prometheus integration
- Loki integration
- Tempo integration
A good dashboard answers a real question:
- Is the service healthy?
- Are users affected?
- Did latency increase?
- Did the latest deployment cause errors?
- Which dependency is failing?
- Are we meeting our SLO?
- Which logs and traces explain this metric spike?
Do not build dashboards for decoration.
Build dashboards for action.
Step 5: Learn Logs
After metrics and dashboards, learn logs.
Logs provide the details that metrics cannot.
Learn:
- Structured logging
- JSON logs
- Log levels
- Log aggregation
- Log parsing
- Log filtering
- Correlation IDs
- Trace IDs
- Log retention
- Log cost control
- Loki or ELK
- Fluent Bit or Fluentd
Good logs are searchable, structured, and connected to traces.
Bad logs are noisy, unstructured, expensive, and difficult to use during incidents.
A beginner should learn how logs support troubleshooting:
- A metric shows error rate increased
- Grafana shows which service is affected
- Logs show the exact error message
- Traces show the request path
- The team identifies the root cause
This is how signals work together.
Step 6: Learn Distributed Tracing
Distributed tracing is essential for microservices.
Learn:
- Spans
- Traces
- Trace IDs
- Span IDs
- Parent-child relationships
- Context propagation
- Sampling
- Trace attributes
- Jaeger
- Zipkin
- Grafana Tempo
- TraceQL basics
- Flame graphs
- Service dependency maps
Tracing is extremely useful for latency debugging.
For example, if checkout is slow, a trace can show whether the delay happened in payment, inventory, database, cache, or an external API.
This is one of the clearest examples of observability value.
Step 7: Learn OpenTelemetry
OpenTelemetry is becoming the standard way to collect telemetry data.
It helps teams generate, collect, process, and export:
- Metrics
- Logs
- Traces
OpenTelemetry is vendor-neutral, which means your application does not need to be tied to only one observability vendor.
Learn:
- OpenTelemetry architecture
- APIs
- SDKs
- Auto-instrumentation
- Manual instrumentation
- OpenTelemetry Collector
- Receivers
- Processors
- Exporters
- OTLP
- Semantic conventions
- Context propagation
- Metrics pipeline
- Logs pipeline
- Traces pipeline
- Kubernetes deployment
OpenTelemetry is especially useful when you want to send telemetry to multiple tools such as Prometheus, Grafana, Jaeger, Tempo, Loki, ELK, Datadog, Dynatrace, or New Relic.
For beginners, the best way to learn OpenTelemetry is through hands-on labs.
Instrument one small application.
Send traces to Jaeger.
Send metrics to Prometheus.
Visualize them in Grafana.
Then add logs and correlation.
That is how the concept becomes real.
Step 8: Learn Kubernetes Observability
Most modern DevOps and SRE teams work with Kubernetes.
Kubernetes observability is a must-have skill.
Learn how to monitor:
- Nodes
- Pods
- Containers
- Deployments
- Services
- Namespaces
- Ingress
- Persistent volumes
- Resource requests
- Resource limits
- HPA
- Cluster events
- Control plane components
- Application workloads
Important tools include:
- Prometheus Operator
- kube-state-metrics
- Node exporter
- Grafana dashboards
- Loki or ELK
- OpenTelemetry Collector
- Jaeger or Tempo
- Alertmanager
Kubernetes observability helps answer:
- Why is my pod restarting?
- Why is the service unavailable?
- Which namespace uses the most CPU?
- Are pods under-provisioned?
- Are resource limits too low?
- Is autoscaling working?
- Did a deployment cause the issue?
For DevOps and SRE engineers, this is where observability becomes daily work.
Step 9: Learn SLOs, SLIs, and Error Budgets
Observability should not stop at charts.
Mature teams use observability to measure reliability.
This is where SRE concepts matter.
SLI
A service-level indicator is a measurement of service behavior.
Examples:
- Availability
- Request success rate
- p95 latency
- p99 latency
- Data freshness
- Error rate
SLO
A service-level objective is a reliability target.
Examples:
- 99.9% availability
- 95% of requests complete under 300 ms
- Error rate stays below 1%
Error Budget
An error budget defines how much unreliability is acceptable.
If your SLO allows 0.1% failure, that 0.1% is your error budget.
SLOs help teams make better decisions.
Instead of asking, “Is CPU high?” you ask, “Are users affected?”
Instead of asking, “Should we deploy?” you ask, “Do we still have enough error budget?”
This is how observability becomes reliability engineering.
Suggested 30-Day Observability Learning Plan
Here is a practical beginner roadmap.
Days 1–5: Observability Foundations
Learn:
- Monitoring vs observability
- Metrics, logs, traces
- Telemetry
- Instrumentation
- Incident response
- SLO basics
Goal: Understand the language of observability.
Days 6–10: Prometheus Basics
Learn:
- Prometheus architecture
- Scraping
- Exporters
- Targets
- Labels
- PromQL basics
- Alerting rules
Goal: Collect and query metrics.
Days 11–15: Grafana Dashboards and Alerts
Learn:
- Grafana data sources
- Panels
- Variables
- Dashboards
- Alert rules
- Notification policies
- Dashboard design
Goal: Build useful dashboards and alerts.
Days 16–20: Logs
Learn:
- Structured logging
- Loki or ELK
- Log parsing
- Log filtering
- Correlation IDs
- Trace IDs
Goal: Investigate problems using logs.
Days 21–25: Traces and OpenTelemetry
Learn:
- Spans
- Traces
- Context propagation
- OpenTelemetry SDK
- OpenTelemetry Collector
- Jaeger or Tempo
Goal: Trace requests across services.
Days 26–30: Kubernetes, SLOs, and Capstone
Learn:
- Kubernetes monitoring
- Pod and node metrics
- SLO dashboards
- Burn-rate alerts
- Failure simulation
- Postmortem writing
Goal: Build a complete observability project.
What Should You Learn First: Prometheus, Grafana, OpenTelemetry, or ELK?
This is a common beginner question.
Here is the recommended order:
- Observability concepts
- Metrics
- Prometheus
- Grafana
- Logs
- Distributed tracing
- OpenTelemetry
- Kubernetes observability
- SLOs and incident response
- Capstone project
Why this order?
Because each skill builds on the previous one.
Prometheus makes more sense when you understand metrics.
Grafana makes more sense when Prometheus has useful data.
Logs make more sense when you can connect them with metrics.
Tracing makes more sense when you understand distributed systems.
OpenTelemetry makes more sense when you already understand metrics, logs, and traces.
Kubernetes observability makes more sense when you understand workloads, services, pods, and telemetry.
This order prevents confusion.
Recommended Observability Training Links with the Right Keywords
Use the following keyword-rich links naturally inside your blog, landing page, or learning content. Each link points to DevOpsSchool’s Master in Observability Engineering Certification because it covers the complete observability learning path: metrics, logs, traces, Prometheus, Grafana, OpenTelemetry, Kubernetes observability, SLOs, assignments, capstones, and certification training.
For Beginners
Start here if you are new to observability and want a complete structured roadmap:
Observability course for beginners
This is the right link for learners who want to understand metrics, logs, traces, Prometheus, Grafana, OpenTelemetry, and Kubernetes observability from the ground up.
For Online Learners
Use this when targeting learners searching for remote or flexible training:
This is useful for professionals who want live, guided, hands-on observability training without depending only on scattered tutorials.
For Certification-Focused Learners
Use this when the user wants a validated learning path:
This is a good fit for learners who want assignments, capstone projects, and certification-based validation.
For DevOps Engineers
Use this when writing for DevOps professionals:
Observability training for DevOps engineers
This is relevant because DevOps engineers need observability to connect deployments, infrastructure, Kubernetes, dashboards, alerts, and production feedback.
For SRE Engineers
Use this when targeting reliability-focused learners:
This works well for SREs who need SLOs, SLIs, error budgets, incident response, burn-rate alerts, and reliability dashboards.
For Hands-On Learners
Use this when the audience wants labs and projects:
This is a strong anchor because hands-on practice is the fastest way to learn production-style observability.
For Grafana Learners
Use this when discussing dashboards and alerts:
Grafana observability training
This is useful for learners who want to build dashboards, alerts, metrics panels, log views, and trace correlation workflows.
For Prometheus Learners
Use this when discussing metrics and monitoring:
This is appropriate for learners who want Prometheus metrics, PromQL, exporters, alerting, and Grafana integration.
For OpenTelemetry Learners
Use this when discussing instrumentation and telemetry pipelines:
This is the right keyword for learners who want to understand OpenTelemetry SDKs, Collector pipelines, traces, metrics, logs, and vendor-neutral observability.
For Kubernetes Learners
Use this when the article focuses on cloud-native systems:
Kubernetes observability course
This is useful for engineers who need to monitor pods, nodes, containers, deployments, services, and Kubernetes workloads.
For Full Career-Focused Training
Use this as the main recommended program link:
Master in Observability Engineering Certification
This is the best anchor text when recommending DevOpsSchool’s complete program for observability engineering, DevOps, SRE, cloud, platform, and application monitoring professionals.
Why DevOpsSchool’s Master in Observability Engineering Certification Is a Strong Fit
A beginner can learn observability in two ways.
The first way is random learning.
You watch one video on Prometheus, one tutorial on Grafana, one blog on OpenTelemetry, one GitHub example for Loki, one Kubernetes dashboard guide, and one article on SLOs. You collect pieces, but you may not understand how everything fits together.
The second way is structured learning.
You start with foundations, then metrics, then Prometheus, then Grafana, then logs, then traces, then OpenTelemetry, then Kubernetes observability, then SLOs, then real projects.
This is where DevOpsSchool’s Master in Observability Engineering Certification fits well.
The program is designed as a complete observability engineering path, not a single-tool tutorial.
It covers:
- Observability foundations
- Metrics, logs, and traces
- Prometheus
- PromQL
- Alertmanager
- Grafana dashboards
- Grafana Alerting
- Loki logs
- Tempo traces
- OpenTelemetry
- OpenTelemetry Collector
- ELK and EFK
- Jaeger and Zipkin
- Datadog
- Dynatrace
- New Relic
- Kubernetes observability
- SLOs, SLIs, and error budgets
- Assignments
- Capstone projects
- Scenario-based certification exam
That breadth matters.
Real companies do not use only one tool.
One team may use Prometheus and Grafana.
Another may use ELK.
Another may use Datadog.
Another may use Dynatrace.
Another may be migrating to OpenTelemetry.
Most cloud-native teams need Kubernetes observability.
A good observability engineer must understand the patterns behind the tools.
The DevOpsSchool certification is a strong fit because it teaches observability as an engineering discipline, not as disconnected software tutorials.
How This Training Helps Beginners
Beginners need structure.
Observability has many tools and terms. Without guidance, it is easy to feel lost.
A structured program helps beginners understand:
- What to learn first
- Why each tool matters
- How metrics, logs, and traces connect
- How Prometheus and Grafana work together
- How OpenTelemetry fits into the stack
- How Kubernetes changes observability
- How SLOs connect observability to reliability
- How to build real projects
For beginners, the biggest benefit is confidence.
You do not just learn definitions.
You build working systems.
How This Training Helps DevOps Engineers
DevOps engineers need observability to validate production after deployment.
They need to know:
- Did the deployment succeed technically?
- Did it affect users?
- Did error rate increase?
- Did latency increase?
- Are pods restarting?
- Are resources under pressure?
- Are alerts meaningful?
- Can we roll back with evidence?
The DevOpsSchool course fits DevOps engineers because it includes Prometheus, Grafana, Kubernetes observability, OpenTelemetry, logs, traces, alerts, and capstones.
This helps DevOps engineers move from deployment automation to production confidence.
How This Training Helps SRE Engineers
SRE engineers need observability for reliability.
They use observability to manage:
- SLIs
- SLOs
- Error budgets
- Burn-rate alerts
- Incident response
- Root cause analysis
- Postmortems
- Reliability dashboards
The DevOpsSchool program fits SRE engineers because it connects observability tools with SRE practices.
SREs do not need dashboards for decoration.
They need dashboards that support reliability decisions.
They need alerts that indicate user impact.
They need traces that identify bottlenecks.
They need logs that confirm root cause.
They need SLOs that guide engineering priorities.
A complete observability course should teach all of that.
How This Training Helps Developers
Developers also benefit from observability.
Modern developers are increasingly responsible for production behavior.
They need to know:
- How their code performs
- Which API endpoints are slow
- Which database queries are expensive
- Which exceptions occur in production
- Which dependencies fail
- How to add custom metrics
- How to add trace spans
- How to write useful structured logs
OpenTelemetry is especially valuable for developers because it helps them instrument applications properly.
A developer who understands observability writes applications that are easier to debug, support, and improve.
Practical Capstone Project for Beginners
If you want to prove your observability skills, build this project.
Project: Full Observability Stack for a Microservices Application
Deploy a sample microservices application on Kubernetes.
Then implement:
- Prometheus for metrics
- Grafana for dashboards
- Loki or ELK for logs
- Jaeger or Tempo for traces
- OpenTelemetry for instrumentation
- Alertmanager or Grafana Alerting for alerts
- SLO dashboard for reliability
- Failure simulation
- Incident report
Your dashboard should show:
- Request rate
- Error rate
- p95 latency
- p99 latency
- CPU usage
- Memory usage
- Pod restarts
- Active alerts
- Error budget burn
- Related logs
- Trace links
Then simulate failures:
- Break one service
- Add artificial latency
- Trigger 500 errors
- Restart pods
- Increase memory usage
- Slow down a database query
- Break an external API dependency
Use your observability stack to find the root cause.
This type of project is excellent for interviews because it proves practical ability.
Common Beginner Mistakes in Observability
Mistake 1: Learning Tools Without Concepts
Do not start with dashboards before understanding metrics, logs, traces, and telemetry.
Concepts first.
Tools second.
Mistake 2: Creating Too Many Dashboards
More dashboards do not mean better observability.
A good dashboard should answer a specific question.
Mistake 3: Alerting on Everything
Too many alerts create alert fatigue.
A good alert should be actionable, urgent, owned, and connected to user impact.
Mistake 4: Ignoring Logs and Traces
Metrics show what changed.
Logs show details.
Traces show request flow.
You need all three.
Mistake 5: Ignoring Cardinality
Bad metric labels can create performance and storage problems.
Avoid labels such as user ID, request ID, and session ID in Prometheus metrics.
Mistake 6: Treating Certification as the Finish Line
Certification is useful, but practical skill matters more.
Use certification as a milestone, not the final destination.
Mistake 7: Not Practicing Incidents
You should intentionally break things in a lab.
That is how you learn real troubleshooting.
How to Choose the Best Observability Course for Beginners
Before choosing an observability course, ask these questions:
- Does it explain observability vs monitoring?
- Does it teach metrics, logs, and traces?
- Does it include Prometheus?
- Does it include Grafana?
- Does it include OpenTelemetry?
- Does it include logs with Loki or ELK?
- Does it include distributed tracing with Jaeger or Tempo?
- Does it include Kubernetes observability?
- Does it teach SLOs and error budgets?
- Does it include hands-on labs?
- Does it include assignments?
- Does it include capstone projects?
- Does it prepare learners for certification?
- Does it teach incident response and root cause analysis?
If the answer is yes, the course is worth serious consideration.
If the course only teaches one tool, it may still be useful, but it is not a complete observability course.
A complete observability course should help you understand the full production picture.
Final Recommendation
If you are a beginner, observability is one of the best skills you can learn for a DevOps, SRE, cloud, platform, or backend engineering career.
Start with the basics.
Understand monitoring vs observability.
Learn metrics, logs, and traces.
Then move into Prometheus, Grafana, logging, distributed tracing, OpenTelemetry, Kubernetes observability, SLOs, alerts, and incident response.
Most importantly, build projects.
Do not only watch tutorials.
Deploy systems, collect telemetry, create dashboards, trigger alerts, simulate failures, and troubleshoot them.
That is how observability becomes real.
The Master in Observability Engineering Certification by DevOpsSchool is a strong fit for this journey because it brings the complete observability stack into one structured path: Prometheus, Grafana, OpenTelemetry, ELK, Jaeger, Kubernetes observability, SLOs, assignments, capstone projects, and certification validation.
For beginners, it gives direction.
For DevOps engineers, it gives production visibility.
For SRE engineers, it gives reliability skills.
For developers, it gives instrumentation confidence.
And for teams, it creates engineers who can look at metrics, logs, and traces and understand what is really happening in production.
That is the true goal of an observability course.
Not just dashboards.
Not just tools.
Real production understanding.
FAQs
What is the best observability course for beginners?
The best observability course for beginners should cover metrics, logs, traces, Prometheus, Grafana, OpenTelemetry, Kubernetes observability, SLOs, alerts, hands-on labs, and capstone projects.
Is observability hard to learn?
Observability can feel complex at first because it includes many tools and concepts. But if you follow a step-by-step learning path, it becomes manageable.
Should I learn Prometheus or Grafana first?
Learn metrics basics first, then Prometheus, then Grafana. Prometheus collects and queries metrics. Grafana visualizes them.
Should beginners learn OpenTelemetry?
Yes, but after understanding metrics, logs, traces, and instrumentation basics. OpenTelemetry is easier to learn when you understand the signals it collects.
Is observability useful for DevOps engineers?
Yes. DevOps engineers use observability to understand production health after deployments, infrastructure changes, and Kubernetes operations.
Is observability useful for SRE engineers?
Yes. SRE engineers use observability for SLOs, error budgets, incident response, reliability dashboards, alerts, and root cause analysis.
What tools should beginners learn for observability?
Beginners should learn Prometheus, Grafana, OpenTelemetry, Loki or ELK, Jaeger or Tempo, Alertmanager, and Kubernetes observability tools.
What is the role of Grafana in observability?
Grafana is used to visualize metrics, logs, traces, alerts, and SLOs through dashboards and panels.
What is the role of Prometheus in observability?
Prometheus collects, stores, and queries metrics. It is widely used for monitoring, alerting, Kubernetes observability, and SLO measurement.
What is the role of OpenTelemetry in observability?
OpenTelemetry helps generate, collect, process, and export telemetry data such as metrics, logs, and traces in a vendor-neutral way.
Is certification important for observability?
Certification is useful when it includes hands-on practice, assignments, projects, and practical assessment. It helps validate skills and gives structure to learning.
Which certification is good for observability beginners?
A broad certification like DevOpsSchool’s Master in Observability Engineering Certification is a good fit because it covers Prometheus, Grafana, OpenTelemetry, logs, traces, Kubernetes observability, SLOs, assignments, and capstone projects.
Very informative and easy-to-follow guide for anyone looking to get started with observability! 👍