This article is based on an interview with Nancy Gohring, senior analyst at 451 Research LLC, conducted by Jeff Frick of theCUBE at the Sumo Logic Illuminate event in Burlingame, California. Disclosure: TheCUBE is a paid media partner for Sumo Logic Illuminate.
The Scale Problem No Dashboard Was Built For
Four billion is a number that challenges human intuition. Now picture four billion Kubernetes container instances — each one generating telemetry data on spin-up, runtime behavior, and spin-down — every single week. According to Nancy Gohring, senior analyst at 451 Research LLC, that is approximately the scale at which Google runs Kubernetes for its own internal workloads.
“If you think of Google launching 4 billion containers every week, they’re collecting a number of different data points,” Gohring said. “It’s not even just four billion pieces of data. The volume of operations data that people are faced with is just out of this world.”
Google is an extreme example, but the underlying trend applies broadly. Any organization running microservices at meaningful scale faces an exponential growth in operational signals: logs, metrics, traces, events, and alerts multiplying with every new service, replica, and deployment pipeline.
Autonomous DevOps Teams and the Oversight Gap
The shift to distributed, autonomous DevOps teams was designed to increase velocity. Small, self-sufficient squads own their services end-to-end — from writing code to running it in production. This model works well for speed, but it introduces a subtle organizational risk: no one may be watching the whole application.
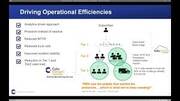
“DevOps are running autonomously; they’re doing their own thing so they can move quickly,” Gohring noted. “But is there anybody overseeing the application that’s made up of maybe a thousand microservices? In some cases, the answer is no.”
When an application is composed of hundreds or thousands of loosely coupled services, each owned by a different team, systemic failures — cascading latency, inter-service dependency issues, degraded user experience — can go undetected until they become customer-impacting incidents. Individual team dashboards only show local health; end-to-end application health requires a broader view.
Tool Sprawl: When Every Team Chooses Its Own Monitoring Stack
The natural response to rising operational complexity is to add monitoring tooling. But in organizations where teams have full autonomy, this often results in a fragmented landscape where each team adopts whichever tool fits its immediate needs — Prometheus for one team, Datadog for another, a bespoke ELK stack for a third.
“As applications are getting much more complex, looking at that data in a siloed tool tends to obscure the bigger picture,” Gohring said. “In most cases, businesses aren’t going to just settle on one monitoring tool that does it all. If you have 100 DevOps teams and they have chosen their own monitoring tools, this is not efficient.”
The practical consequences of monitoring tool sprawl include:
- Correlation blind spots: When logs, metrics, and traces live in separate systems, correlating an anomaly in one service with a root cause in another becomes a manual, time-consuming process.
- Duplicated licensing and operational costs: Maintaining multiple monitoring platforms multiplies vendor contracts, training overhead, and integration work.
- Inconsistent alerting standards: Teams using different tools will configure thresholds, severities, and on-call workflows differently, leading to inconsistent incident response.
- Onboarding friction: Engineers rotating between teams or responding to cross-team incidents must context-switch between unfamiliar dashboards under pressure.
The Push Toward Autonomous and Unified Monitoring
The data volume problem is large enough that human operators alone cannot triage it in real time. This is pushing vendors and platform teams toward two complementary approaches:
- Autonomous/AI-assisted monitoring: Systems that automatically detect anomalies, suppress noise, and surface only the signals that require human attention — reducing alert fatigue and speeding mean time to detect (MTTD).
- Unified observability platforms: Consolidating logs, metrics, and traces into a single platform gives teams a shared language for application health and enables cross-team correlation without requiring everyone to adopt the same instrumentation library.
Neither approach eliminates the need for skilled engineers, but both aim to make the signal-to-noise ratio manageable at cloud-native scale.
Practical Takeaways for DevOps and Platform Teams
If your organization is feeling the strain of monitoring tool sprawl or drowning in operational telemetry, consider the following steps:
- Audit your current tooling landscape. Map which teams use which monitoring tools and identify where correlation gaps exist between services.
- Establish organization-wide observability standards. Define minimum requirements for logging format, metric naming conventions, and distributed tracing instrumentation — without mandating a single tool everywhere.
- Designate application-level ownership. Beyond service-level ownership, assign responsibility for monitoring the health of entire user-facing application flows, not just individual microservices.
- Evaluate consolidation incrementally. Full platform consolidation is disruptive. Start by federating data into a central store for querying and alerting, while allowing teams to retain their preferred instrumentation.
- Build runbooks that span services. Incident response documentation should reflect the reality that failures rarely respect service boundaries.
The Bigger Picture
The operations data avalanche is not a temporary growing pain — it is a structural feature of cloud-native architectures. As container density, deployment frequency, and microservice counts continue to rise, the gap between the data generated and a team’s capacity to interpret it will only widen. Organizations that address monitoring fragmentation proactively will be better positioned to maintain reliability and developer productivity at scale.
Source interview originally published by SiliconANGLE / theCUBE, recorded at the Sumo Logic Illuminate event.