Originally reported by StorageReview.com. Event: Perform 2020 conference, February 2020.
Overview
At its annual Perform 2020 conference, Dynatrace announced the next generation of its Infrastructure Monitoring module, part of the company’s all-in-one Software Intelligence Platform. The release targets a core challenge facing modern engineering teams: traditional monitoring tools struggle to keep pace with hybrid and multi-cloud architectures, microservices sprawl, and the explosive adoption of Kubernetes as a container orchestration platform.
The updated platform introduces enhanced AI-driven analysis, broader out-of-the-box observability, custom metrics derived from log data, and significantly expanded support for Kubernetes environments — all surfaced through Dynatrace’s explainable AI engine, Davis.
Why Infrastructure Monitoring Needed an Update
Over the past several years, enterprise infrastructure has shifted dramatically away from traditional data centers toward hybrid and multi-cloud deployments. At the same time, microservices architectures have become the norm rather than the exception. These shifts make it progressively harder to use conventional point monitoring tools, which were designed for more static, homogeneous environments.
Faced with gaps in existing tooling, many organizations have resorted to building bespoke monitoring solutions internally — an approach that brings its own operational burden, inconsistency, and technical debt. Dynatrace’s Infrastructure Monitoring enhancements are positioned to consolidate these fragmented approaches into a single, AI-powered platform.
New Infrastructure Monitoring Enhancements
The following capabilities were added to the Dynatrace Infrastructure Monitoring module:
Extended Out-of-the-Box Observability for Cloud-Native Environments
Dynatrace now automatically ingests data from a broader set of sources without requiring manual instrumentation. New sources include additional AWS and Azure services, Kubernetes-native events, Prometheus OpenMetrics, and Spring Micrometer metrics. This expanded coverage is designed to provide comprehensive observability at scale across multi-cloud environments, reducing the time to detect and resolve performance problems.
Custom Metrics and Events from Log Monitoring
A significant new capability allows teams to derive custom metrics and events directly from log data. Any application, script, or process that writes to a log file can now be brought into the observability scope of the Dynatrace platform. This reduces the need for separate log aggregation and alerting tools, supporting tool consolidation and lowering the administrative overhead associated with maintaining multiple monitoring pipelines.
Smarter, AI-Driven Infrastructure Monitoring
The Davis AI engine has been extended to automatically generate thresholds and baselining algorithms for all infrastructure performance and reliability metrics. Previously, setting sensible alert thresholds in dynamic cloud environments often required manual configuration and ongoing tuning. With automatic baselining, Davis performs root-cause analysis across infrastructure metrics without requiring engineers to pre-define what “normal” looks like — a meaningful reduction in operational toil at scale.
Expanded Kubernetes Support
Kubernetes has emerged as the dominant container orchestration platform, with adoption continuing to grow across industries. As Kubernetes deployments scale — spanning multiple clusters, namespaces, and heterogeneous workloads — visibility into cluster health, resource utilization, and inter-service dependencies becomes increasingly complex. Dynatrace addressed this directly with several targeted Kubernetes enhancements.
Precise, AI-Powered Answers for Kubernetes Events
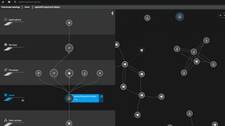
Davis now ingests additional Kubernetes events and metrics, including state changes, workload changes, and critical events across clusters, containers, and runtimes. By understanding the dependencies and relationships across the full Kubernetes stack — from cluster level down to individual container workloads — Davis can deliver precise, real-time answers about performance anomalies. The goal is to dramatically simplify Kubernetes rollout and ongoing management by replacing manual triage with AI-driven root-cause identification.
Cloud Application and Microservice Resource Analysis
New analysis capabilities allow platform administrators and application owners to understand and optimize Kubernetes resource utilization. Teams can now proactively identify performance bottlenecks and resource contention issues before they escalate into user-facing incidents, enabling more informed capacity planning and cost optimization decisions.
Extended Automatic Container Instrumentation
Dynatrace extended its automatic discovery, instrumentation, and topology mapping to cover heterogeneous container runtimes within Kubernetes environments. This includes support for Docker, CRI-O, and other container implementations. New container resource usage analysis broadens coverage across the range of runtimes in use today. The result is that even large, complex containerized environments can be brought under full-stack observability without requiring per-container manual instrumentation.
Key Takeaways for DevOps and Platform Engineering Teams
- Reduced manual configuration: Automatic baselining and AI-driven thresholds lower the operational burden of managing alert policies across dynamic, ephemeral infrastructure.
- Broader data ingestion: Native support for Prometheus OpenMetrics and Spring Micrometer makes it easier to integrate Dynatrace into existing observability pipelines without replacing them outright.
- Log-to-metric conversion: Custom metrics from log events open observability to legacy or custom-built applications that do not expose structured telemetry.
- Full-stack Kubernetes visibility: Automated instrumentation across Docker and CRI-O runtimes, combined with Davis’s enriched Kubernetes event ingestion, addresses one of the most common pain points in large-scale container operations.
- Tool consolidation: By combining infrastructure metrics, log-based events, and container observability in a single platform, teams can reduce the number of disparate tools they need to maintain.
Source and Further Reading
This article is based on reporting originally published by StorageReview.com covering announcements made at the Dynatrace Perform 2020 conference. For the latest information on Dynatrace Infrastructure Monitoring and Kubernetes support, refer to the official Dynatrace website.