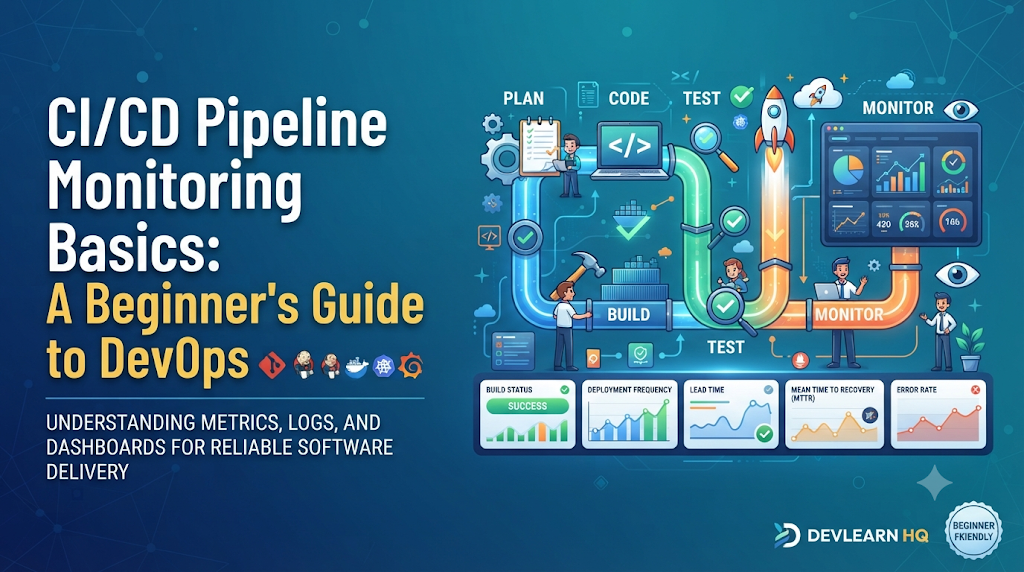
Introduction: Why Monitoring Matters in Automated Delivery
Imagine a development team that has successfully automated its entire software delivery process. Code commits trigger automated builds, unit tests run without manual intervention, and artifacts are packaged seamlessly. At first, the team feels invincible. However, within a few weeks, invisible friction begins to accumulate. Developers notice that code changes take much longer to reach staging environments, but nobody knows why. Occasionally, builds fail silently, tests hang indefinitely without throwing clear errors, and critical deployments stall. The automation engine is running, but the team is completely blind to its internal behavior. This scenario highlights a fundamental reality in modern software engineering: automation alone is not enough. While Continuous Integration and Continuous Deployment (CI/CD) pipelines eliminate manual toil, they introduce new layers of complexity. Without visibility into how these pipelines execute, teams are left guessing when builds slow down, why tests fail, or how resource bottlenecks impact delivery speed.
This is where pipeline monitoring becomes essential. Pipeline monitoring is the practice of observing, measuring, and analyzing every stage of an automated software delivery workflow. It provides the telemetry needed to identify problems before they affect downstream environments or disrupt end users. Whether you are a student, an aspiring DevOps engineer, a software developer, a QA professional, or a working IT professional looking to level up your skill set, understanding pipeline monitoring is a core competency. For structured guidance on mastering these DevOps concepts and developing hands-on technical proficiencies, platforms like DevOpsSchool offer comprehensive learning pathways and practical training environments. In this guide, we will explore everything you need to transition from automated delivery novice to a practitioner who understands the health, performance, and reliability of software pipelines.
1. What Exactly Is Pipeline Monitoring?
At its core, pipeline monitoring involves capturing real-time data about how code moves through a CI/CD workflow. It is not a single tool or a one-time check; rather, it is a continuous observation mechanism across multiple dimensions:
- Monitoring the execution of pipeline stages: Tracking whether a workflow is currently running, waiting, completed, or aborted.
- Tracking build, test, and deployment status: Verifying the pass/fail state of every discrete action within the pipeline.
- Identifying failed or delayed jobs: Pinpointing exact steps or runner tasks that cause blockages or errors.
- Observing pipeline duration and resource usage: Measuring how long jobs take and how much CPU, memory, or disk space they consume.
- Recording execution history: Storing historical runs to compare current performance against past baselines.
- Detecting unusual patterns and repeated failures: Spotting flaky tests, infrastructure instability, or recurring configuration regressions.
Distinguishing Pipeline Monitoring from Application and Infrastructure Monitoring
To avoid confusion, it helps to draw clear boundaries between different types of monitoring:
- Pipeline Monitoring: Focuses exclusively on the software delivery lifecycle. It answers questions like: Why did the build fail? How long did unit tests take? Is the deployment script executing successfully?
- Application Monitoring (APM): Focuses on the running software product in production or staging. It answers questions like: What is the API response time? Are users experiencing HTTP 500 errors? How much memory is the web service leaking?
- Infrastructure Monitoring: Focuses on the underlying physical or virtual host machines, clusters, and networks. It answers questions like: Is the Kubernetes node CPU at 90% capacity? Is storage running out on the database server?
Practical Example: If an application crashes in production because of a null pointer exception, that is an Application Monitoring concern. If the underlying virtual machine running the database runs out of disk space, that is an Infrastructure Monitoring concern. However, if a developer’s code change fails to build because the CI runner lost connectivity to the package registry, that is a Pipeline Monitoring concern.
2. Follow the Journey of a Pipeline Run
To monitor a pipeline effectively, you must understand the sequential stages that software changes traverse. Each stage introduces unique risks, failure modes, and metrics worth tracking.
[Source Code] --> [Checkout] --> [Dependencies] --> [Build] --> [Test] --> [Security Scan] --> [Artifacts] --> [Deploy] --> [Validation]
Code language: CSS (css)
1. Source Code Checkout
- What to monitor: Git clone duration, branch validation, and authentication success.
- Common failures: Network timeouts, invalid SSH keys, missing branch references.
- Why visibility matters: If the pipeline cannot fetch the latest code, no subsequent work can begin.
2. Dependency Installation
- What to monitor: Package download speeds, cache hit/miss rates, and mirror availability.
- Common failures: Registry downtime (e.g., npm, PyPI, Maven Central), corrupted lock files, checksum mismatches.
- Why visibility matters: Dependency resolution often consumes significant time and is prone to external network fluctuations.
3. Build and Compilation
- What to monitor: Compilation time, compiler warning counts, and memory consumption.
- Common failures: Syntax errors, missing header files, incompatible library versions.
- Why visibility matters: This is the first definitive check of code validity. Tracking duration highlights code bloat or inefficient build configurations.
4. Automated Testing
- What to monitor: Number of passed, failed, and skipped unit/integration tests; test suite execution time.
- Common failures: Assertions failing due to logic bugs, environment-dependent test failures (“flaky tests”).
- Why visibility matters: Tests protect software quality. Knowing which test failed prevents defective code from advancing.
5. Code Quality and Security Checks
- What to monitor: Static analysis warnings, vulnerability scan results, and license compliance flags.
- Common failures: Introduction of critical Common Vulnerabilities and Exposures (CVEs), low code coverage scores.
- Why visibility matters: Catching security vulnerabilities early prevents costly fixes in production.
6. Artifact Creation and Storage
- What to monitor: Artifact file size, compression duration, and registry upload status.
- Common failures: Storage authentication errors, exceeding storage quotas, malformed packaging.
- Why visibility matters: Deployments rely on immutable, verified artifacts stored securely in artifact repositories.
7. Deployment
- What to monitor: Target environment connection status, script execution progress, and rollout duration.
- Common failures: Incorrect environment variables, insufficient cloud permissions, port conflicts.
- Why visibility matters: Moving code into staging or production carries the highest operational risk.
8. Post-Deployment Validation
- What to monitor: Smoke test execution, health endpoint checks, and initial error rates.
- Common failures: Post-deploy smoke tests returning non-200 HTTP status codes, routing misconfigurations.
- Why visibility matters: Validation ensures that the newly deployed version is operational before traffic is routed to it.
3. The Signals Every Beginner Should Understand
Effective monitoring relies on interpreting key signals generated during pipeline execution.
- Execution Status: The binary or categorical state of a workflow (Success, Failure, Cancelled, In Progress, or Skipped). This is your primary indicator of workflow health.
- Duration: The elapsed time from job initiation to completion. Tracking duration across individual stages helps isolate performance bottlenecks.
- Failure Frequency: The ratio of failed runs to total runs over a given time window. High failure rates indicate unstable codebases or unreliable test environments.
- Queue Time: The duration a job sits idle waiting for an available runner or agent. High queue times suggest resource starvation or insufficient runner capacity.
- Test Results: Quantitative counts of passed, failed, skipped, and unstable tests. Tracking test trends reveals underlying quality drift.
- Deployment Status: Confirmation of whether a release target successfully accepted the new artifact and passed initial health checks.
- Resource Usage: CPU, memory, and disk utilization metrics recorded by the runner executing the pipeline tasks.
4. Understanding Pipeline Logs, Metrics, and Notifications
To diagnose pipeline issues efficiently, practitioners rely on three complementary sources of information: logs, metrics, and notifications.
Logs
Logs are granular, timestamped text records generated line-by-line during tool execution. When a build fails, logs provide the exact traceback, compiler error, or assertion failure.
- Best practice: Look for error codes (
exit status 1), stack traces, and highlighted warning keywords (ERR!,FAILED).
Metrics
Metrics are aggregated numerical measurements collected over time (e.g., average build duration in minutes, daily failure count). They allow teams to spot macro trends, such as a gradual increase in build times over several weeks.
Notifications
Notifications are proactive alerts sent via communication channels (such as Slack, Webex, email, or chatops) when a pipeline state changes.
Realistic Diagnostic Example:
- Notification: A Slack alert fires:
Pipeline #412 failed in stage [Integration Test]. - Metric Check: The dashboard shows that the test stage duration spiked from 3 minutes to 15 minutes before timing out.
- Log Investigation: Opening the pipeline logs reveals a database connection timeout error caused by an unstarted test container.
- Resolution: The developer corrects the docker-compose setup, and the subsequent pipeline run succeeds.
Note on Notifications: Alerts should be actionable and targeted. If every minor warning triggers an urgent notification, teams experience alert fatigue and begin ignoring critical failure warnings.
5. Setting Up a Basic Monitoring Lab
To cement these concepts, let us design a beginner-friendly monitoring lab using standard open-source tools.
Lab Architecture & Prerequisites
- Source Code Repository: A sample repository hosted on GitHub containing a simple Node.js or Python application with basic unit tests.
- CI/CD Platform: GitHub Actions or GitLab CI/CD (both offer free tier runners suitable for learning).
- Monitoring View: Native pipeline execution dashboard provided by the CI/CD platform.
- Notification Channel: A webhook integration connected to a test chat channel or email notification.
Step-by-Step Lab Setup
- Fork or clone the sample application repository into your personal version control account.
- Define a basic CI/CD workflow file (e.g.,
.github/workflows/ci.yml) that includes checkout, dependency installation, build, and test steps. - Enable pipeline history tracking by executing a few test commits.
- Configure a notification trigger within the platform settings to alert you upon build failure.
- Review the execution history interface to observe logs, duration timers, and stage statuses.
6. Practical Monitoring Exercises
These four hands-on exercises will guide you through core monitoring tasks in a safe learning environment.
Exercise 1: Track Pipeline Execution Status
- Learning Objective: Identify different job states in a workflow runner.
- Required Tools: GitHub Actions or GitLab CI/CD.
- Setup Instructions: Create a workflow with three sequential dummy steps (
echo "Step 1",sleep 5,echo "Step 3"). - Monitoring Activity: Trigger the pipeline. Observe the visual indicators change from queued (yellow/grey) to running (blue/spinning) to success (green). Next, deliberately add an
exit 1command in Step 2 to force a failure (red). - Expected Observations: Clear visual differentiation between successful, failed, and pending jobs.
- Common Mistakes: Confusing skipped jobs with failed jobs.
- Verification Steps: Check that the pipeline visualizer accurately reflects the exact failing step.
Exercise 2: Measure Build and Pipeline Duration
- Learning Objective: Measure and compare execution duration across stages.
- Required Tools: CI/CD platform with native step timers.
- Setup Instructions: Add a deliberate delay command (e.g.,
sleep 10) to one specific stage in your pipeline. - Monitoring Activity: Run the pipeline three times. Note the total duration and the time consumed by each stage.
- Expected Observations: Identifying that the artificial delay extends the total pipeline runtime predictably.
- Common Mistakes: Ignoring runner spin-up time when calculating pure build time.
- Verification Steps: Compare timestamps between stage start and end logs.
Exercise 3: Monitor a Failed Test Stage
- Learning Objective: Locate and interpret test failure logs.
- Required Tools: Sample app with unit tests (e.g., Jest or PyTest).
- Setup Instructions: Modify a unit test assertion so that it expects an incorrect value (e.g., expecting
5when the function returns4). - Monitoring Activity: Commit the change and push to trigger the pipeline. Navigate to the test execution summary.
- Expected Observations: Test runner output showing assertion failure details, file names, and line numbers.
- Common Mistakes: Looking only at the top-level pipeline status without expanding the test stage logs.
- Verification Steps: Revert the test assertion, re-run the pipeline, and verify the test stage returns to a green passing state.
Exercise 4: Configure Failure Notifications
- Learning Objective: Set up and verify pipeline failure alerts.
- Required Tools: CI/CD platform notification settings or webhook tester.
- Setup Instructions: Enable email or webhook notifications for failed runs in your repository settings.
- Monitoring Activity: Trigger a broken build and check your inbox or webhook receiver for the alert message.
- Expected Observations: Receiving a notification containing the commit message, author, branch name, and direct link to the failed run.
- Common Mistakes: Setting up overly broad notifications that flood your inbox with success messages.
- Verification Steps: Confirm that successful runs do not trigger alerts, while failed runs generate immediate notifications.
7. Building a Useful Pipeline Monitoring Dashboard
A well-designed monitoring dashboard gives engineers an instant snapshot of delivery health without cluttering their view with noise.
Essential Dashboard Elements
- Recent Pipeline Executions: A chronological list of recent runs with visual status badges.
- Success and Failure Status: High-level pass/fail ratios over the last 24 hours or 7 days.
- Average Pipeline Duration: Trend lines showing how long complete runs take over time.
- Stage-Level Execution Time: Breakdown showing which specific stage (build vs. test vs. deploy) consumes the most time.
- Failed Test Counts: Aggregate count of failing tests across branches.
- Deployment Status: Indicator showing the current version deployed to staging or production environments.
- Repeated Failure Patterns: Highlighting jobs that fail consecutively.
- Runner/Agent Availability: Status of compute agents executing the jobs.
Illustrative Dashboard Layout
+-------------------------------------------------------------------------+
| PIPELINE HEALTH DASHBOARD                                               |
+----------------------------------+--------------------------------------+
| [Status] Overall: HEALTHY (92%)  | [Duration] Avg: 4m 12s               |
| Active Runners: 4 / 4 Online     | Queue Time: 12s                      |
+----------------------------------+--------------------------------------+
| RECENT RUNS                      | STAGE BREAKDOWN                      |
| #415 - main - PASS - 3m 50s      | Checkout: 15s                        |
| #414 - feature - FAIL - 5m 10s   | Install Deps: 45s                    |
| #413 - main - PASS - 4m 02s      | Build & Test: 2m 10s                 |
| #412 - main - PASS - 3m 58s      | Deploy: 42s                          |
+----------------------------------+--------------------------------------+
Code language: PHP (php)
Design Principle: A good dashboard highlights anomalies immediately. If an engineer has to hunt through five menus to see why a build failed, the dashboard design needs simplification.
8. Monitoring Tools and Platform Capabilities
Different tools serve different roles in the CI/CD ecosystem. Beginners do not need a complex enterprise observability stack to get started.
- Jenkins Built-in Capabilities: Offers robust job execution history, console log viewers, and plugin ecosystems (like JUnit attachment viewers and Build Monitor plugins).
- GitHub Actions Workflow Run Information: Provides visual step-by-step logs, execution timelines, artifact downloads, and run summaries directly in the repository interface.
- GitLab CI/CD Pipeline Monitoring: Features comprehensive pipeline graphs, job analytics, test reports, and environment deployment tracking out of the box.
- Prometheus and Grafana: Advanced open-source tools used to scrape metrics from CI/CD runners and build custom visual dashboards for enterprise scale.
- OpenTelemetry: Emerging standard for collecting and correlating telemetry data across complex distributed systems.
- Log Management Platforms: Dedicated tools (such as ELK stack or cloud log aggregators) used when pipeline logs need to be archived and searched across hundreds of concurrent build agents.
9. How to Recognize a Pipeline Health Problem
Learning to spot early warning signs prevents minor workflow hiccups from becoming major delivery blockages. Watch out for these symptoms:
- Build duration suddenly increases: Often caused by uncached dependency downloads or bloated artifact packaging.
- Failure frequency rises: Usually indicates flaky tests, broken environment dependencies, or unstable trunk code.
- Jobs remain queued for too long: Points to runner resource exhaustion or concurrency limits being reached.
- A test stage repeatedly fails: Highlights either a genuine regression in code or an environmentally dependent test.
- Deployment jobs become unstable: Often caused by credential expiration, network ACL changes, or target environment drift.
- Runners frequently become unavailable: Indicates underlying infrastructure or node provisioning failures.
- Resource usage reaches capacity: Runners running out of disk space due to uncleaned build caches.
- Notifications are missing or too noisy: Teams missing critical failures because alerts are misconfigured.
By comparing current execution metrics against historical baselines, learners can quickly isolate whether a problem is isolated to a single commit or systemic across the delivery pipeline.
10. Basic Metrics for Evaluating Pipeline Health
To quantify delivery performance, DevOps teams track several foundational metrics:
- Pipeline Success Rate: Percentage of total pipeline runs that complete successfully. ($(\text{Successful Runs} / \text{Total Runs}) \times 100$)
- Pipeline Failure Rate: Percentage of runs that fail. Helps gauge overall codebase stability.
- Average Execution Duration: The mean time taken for a pipeline to run from start to finish.
- Build Queue Time: The duration jobs wait for an available runner. High queue times indicate resource bottlenecks.
- Deployment Frequency: How often code is successfully deployed to environments.
- Change Failure Rate: Percentage of deployments that cause a failure in production or require immediate remediation.
- Mean Time to Recovery (MTTR): How long it takes to fix a broken pipeline or recover from a failed deployment.
- Test Failure Rate: Proportion of tests failing during automated test execution.
Contextual Interpretation: Metrics should always be interpreted in context. For example, a pipeline that runs twice as fast is not necessarily healthier if security scans and test suites were disabled to achieve that speed.
11. Common Monitoring Mistakes Beginners Should Avoid
As you begin building and monitoring pipelines, watch out for these frequent pitfalls:
- Monitoring only the final pipeline status: Looking strictly at the final green/red badge misses critical stage-level performance degradation.
- Ignoring stage-level execution details: Failing to check individual step logs makes troubleshooting slow and inefficient.
- Treating logs and metrics as interchangeable: Relying solely on numerical metrics without reading logs (or vice versa) leaves blind spots during investigations.
- Creating too many alerts: Setting up notifications for every minor warning leads directly to alert fatigue.
- Ignoring historical performance: Failing to baseline normal run durations makes spotting slow performance drift impossible.
- Tracking metrics without understanding their purpose: Collecting metrics just for the sake of dashboards without driving actionable improvements.
- Failing to monitor deployment results: Assuming a successful build artifact equals a successful live deployment without running post-deploy checks.
- Exposing secrets in logs or dashboards: Accidentally printing passwords, API tokens, or SSH keys into plain-text build logs.
- Assuming a successful pipeline guarantees a healthy application: Remember that green CI/CD pipelines verify that tests passed, not that the software is free of business logic flaws in production.
12. A Learning Path From Basic Monitoring to Advanced Observability
Becoming proficient in pipeline monitoring is a progressive journey. Here is a structured roadmap for your professional development:
Beginner Level
- Understand pipeline stages and workflow syntax.
- Read execution logs to troubleshoot basic build errors.
- Track job status (Success, Failure, Pending).
- Measure basic pipeline duration.
Intermediate Level
- Design and configure functional monitoring dashboards.
- Set up targeted, actionable failure alerts.
- Compare historical pipeline performance against current runs.
- Investigate recurring flaky tests and environmental failures.
Advanced Level
- Correlate pipeline metrics with infrastructure and application telemetry.
- Monitor distributed, auto-scaling build agent environments.
- Analyze deep pipeline bottlenecks using custom metrics collectors.
- Continuously optimize monitoring automation and alert quality.
Each level builds directly upon the previous one, preparing you to handle complex enterprise software delivery challenges with confidence.
13. Frequently Asked Questions
1. What is pipeline monitoring in DevOps?
Pipeline monitoring is the practice of tracking, measuring, and analyzing the execution, performance, and health of automated CI/CD software delivery workflows.
2. Why should beginners learn CI/CD monitoring?
Beginners must learn monitoring because automation alone cannot diagnose bottlenecks, failed tests, or slow builds. Monitoring provides the visibility needed to keep delivery workflows reliable.
3. What are the most important pipeline monitoring metrics?
Key metrics include pipeline success rate, execution duration, build queue time, test failure rate, and deployment frequency.
4. How are pipeline logs different from metrics?
Logs are detailed, timestamped text records of a single execution used for deep troubleshooting, whereas metrics are numerical measurements used to track performance trends over time.
5. Can Jenkins pipelines be monitored?
Yes. Jenkins offers built-in execution history, console log views, stage view plugins, and integrations with external dashboards like Grafana.
6. How can learners monitor GitHub Actions workflows?
GitHub Actions provides native visual execution graphs, step-by-step logs, run summaries, and notification integrations accessible directly within your repository.
7. Do beginners need Prometheus and Grafana for pipeline monitoring?
No. Beginners can start entirely with the native dashboards and log viewers built into modern CI/CD platforms like GitHub Actions, GitLab CI/CD, or Jenkins.
8. What should a basic pipeline dashboard display?
A basic dashboard should show recent execution statuses, average pipeline duration, stage-level execution times, failed test counts, and runner availability.
9. How can teams reduce unnecessary pipeline alerts?
Teams can reduce alert fatigue by sending notifications only on actionable failures (like broken main branches) rather than every minor warning or successful run.
10. Does a successful pipeline always mean a successful deployment?
Not necessarily. A successful pipeline confirms that build and test steps passed, but post-deployment validation is still required to verify that the application is operating correctly in its target environment.
Conclusion: Make Pipeline Visibility Part of DevOps Learning
Pipeline monitoring bridges the gap between automated execution and operational reliability. By understanding how to track pipeline stages, interpret logs, measure duration, and configure meaningful alerts, learners gain the foundational skills needed to diagnose delivery bottlenecks and ensure robust software releases. Effective monitoring is not about collecting endless charts or noisy alerts; it is about gathering the right signals to make informed engineering decisions. As you continue your technical education, practice setting up basic monitoring in your labs, review your execution history regularly, and treat pipeline health as a first-class priority. For those looking to further sharpen their expertise and build structured, production-ready DevOps skills, exploring the learning programs at DevOpsSchool provides an excellent path forward.