Note: This article is an independent technical explainer on Docker monitoring. It was prompted by a 2019 market research teaser (originally sourced from marketresearchtime.com) that listed competitive vendors but provided no substantive technical content. The information below is written to be genuinely useful for DevOps engineers evaluating container monitoring solutions.
Why Docker Monitoring Matters
Docker containers are ephemeral by design. They spin up in seconds, scale horizontally across nodes, and terminate just as quickly. This lifecycle makes traditional host-based monitoring approaches inadequate. Without purpose-built container monitoring, teams are left blind to resource contention, network bottlenecks, failed health checks, and cascading failures between services.
Effective Docker monitoring needs to answer at least three questions continuously:
- Is the container running? — Health status, restart loops, exit codes.
- How is it performing? — CPU, memory, network I/O, and disk I/O per container.
- How does it interact with other services? — Service maps, latency between containers, dependency failures.
Core Metrics to Collect from Docker Environments
Docker exposes runtime metrics through its Stats API (docker stats) and via the /sys/fs/cgroup filesystem on Linux hosts. Any serious monitoring solution must ingest and contextualise these signals:
| Metric Category | Key Signals |
|---|---|
| CPU | CPU usage per container, throttling percentage, system vs. user time |
| Memory | RSS, cache, memory limit, OOM kill events |
| Network | Bytes in/out per interface, packet drops, errors |
| Block I/O | Read/write bytes, I/O wait |
| Container lifecycle | Start/stop events, restart count, exit codes, health check status |
| Image & orchestration metadata | Image name, tag, container labels, Compose service name, Swarm or Kubernetes context |
Major Platforms in the Docker Monitoring Space
The 2019 market report highlighted several vendors that remain central to this space. Below is a factual summary of each platform’s general approach to Docker and container monitoring — based on publicly available product documentation rather than proprietary market data.
Datadog
Datadog deploys a host-level Agent that automatically discovers running containers via the Docker socket. It collects cgroup metrics, maps container labels to tags, and provides pre-built dashboards for Docker, Kubernetes, and ECS. Its Application Performance Monitoring (APM) layer traces requests across container boundaries using distributed tracing.
Dynatrace
Dynatrace uses a OneAgent that auto-instruments processes inside containers without requiring code changes. Its Smartscape topology continuously maps dependencies between containers, services, and underlying infrastructure. AI-driven anomaly detection (Davis) correlates container-level signals with application performance degradation.
AppDynamics (Cisco)
AppDynamics focuses heavily on application-centric monitoring. Its agents instrument JVM, .NET, Node.js, and other runtimes running inside containers, tying business transaction performance back to container resource utilisation. Infrastructure monitoring for Docker is available as a complementary module.
Splunk (including SignalFx / Splunk Observability Cloud)
Splunk covers two main use cases for containers: log aggregation and metrics-based observability. Docker daemon logs and container stdout/stderr can be shipped to Splunk via the Universal Forwarder or the Splunk Connect for Docker. Splunk Observability Cloud (formerly SignalFx) provides streaming metrics and APM for containerised workloads with OpenTelemetry-native ingestion.
Open-Source and Self-Hosted Alternatives
Commercial platforms are not the only option. Many teams combine open-source components to build a capable container monitoring stack:
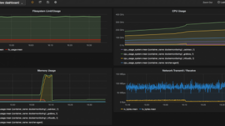
- Prometheus + cAdvisor: cAdvisor (Container Advisor) is a Google-maintained daemon that exports container resource metrics in the Prometheus exposition format. Scraping it with Prometheus and visualising with Grafana is one of the most common self-hosted setups.
- Elastic Stack (ELK/EFK): Filebeat or Fluentd collect container logs and ship them to Elasticsearch for querying and alerting via Kibana.
- Grafana + Loki: Loki is a log aggregation system designed for cloud-native environments. Promtail ships Docker logs to Loki, enabling correlated metrics and log queries in Grafana.
- OpenTelemetry Collector: A vendor-neutral agent that can collect traces, metrics, and logs from containerised applications and route them to multiple backends.
Key Evaluation Criteria When Choosing a Docker Monitoring Tool
Selecting the right monitoring platform depends on your team’s scale, stack, and operational maturity. Consider the following criteria:
- Auto-discovery: Can the tool automatically detect new containers without manual configuration? This is essential in dynamic environments.
- Label and tag propagation: Does the tool use Docker labels and environment variables to enrich metrics with service context?
- Orchestrator integration: If you are running Docker Swarm or Kubernetes, does the tool natively understand pod, service, and node relationships?
- Cardinality handling: High container churn generates high-cardinality time series. Evaluate how the platform handles this at scale without ballooning storage costs.
- Log and metric correlation: Can you pivot from a CPU spike directly to the relevant container logs in the same UI?
- Alerting and anomaly detection: Static thresholds are insufficient for autoscaling environments. Look for dynamic baselines or ML-assisted anomaly detection.
- Total cost of ownership: SaaS platforms price by host, container, or ingested data volume. Model your expected usage before committing.
Regional Adoption Patterns
Container adoption and the tooling choices organisations make vary by region, driven by cloud provider preference, regulatory environment, and engineering culture. North America and Western Europe have historically led enterprise container adoption, while Asia-Pacific — particularly China, India, Japan, and South Korea — represents a significant and fast-growing segment for container orchestration and monitoring tooling. South America and the Middle East and Africa markets are growing from a smaller base, often leaning on globally available SaaS platforms rather than on-premises deployments.
Summary
Docker monitoring is a mature but continuously evolving discipline. Whether you choose a commercial all-in-one platform like Datadog or Dynatrace, or assemble an open-source stack around Prometheus, cAdvisor, and Grafana, the fundamentals are the same: collect container-level metrics, correlate them with application performance data, preserve logs alongside metrics, and alert on meaningful signals rather than raw thresholds. As container density grows and environments shift toward Kubernetes and serverless containers, observability tooling continues to be a critical investment for any team running production workloads in Docker.