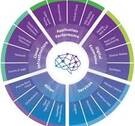
Application Performance Monitoring (APM) tools have become a foundational layer in modern DevOps and SRE practices. As distributed architectures, microservices, and cloud-native deployments grow more complex, the demand for robust APM solutions has expanded well beyond simple uptime checks. This article examines the major players, product categories, target verticals, and regional dynamics shaping the APM tooling landscape.
What Is APM and Why Does It Matter for DevOps?
APM tools give engineering and operations teams real-time visibility into the performance and health of applications running in production. They surface bottlenecks, trace slow transactions, correlate errors with deployments, and feed alerting pipelines. In a CI/CD world where code ships multiple times per day, APM is the feedback loop that closes the gap between deployment and user impact.
Modern APM platforms typically combine several observability capabilities: distributed tracing, metrics collection, log correlation, synthetic monitoring, and — increasingly — AI-assisted anomaly detection and root-cause analysis.
Major APM Vendors
The APM market is served by a mix of pure-play observability companies and large enterprise software vendors. Key players include:
- AppDynamics (Cisco) – Enterprise-focused APM with deep application topology mapping and business transaction monitoring. Widely deployed in large BFSI and retail environments.
- New Relic – Full-stack observability platform offering APM, infrastructure monitoring, browser and mobile monitoring, and logs in a single SaaS product. Moved to a consumption-based pricing model.
- Dynatrace – Known for its AI engine (Davis) and automatic full-stack instrumentation via a single agent. Strong in enterprise cloud and Kubernetes environments.
- Microsoft (Azure Monitor / Application Insights) – Tightly integrated with Azure services, Application Insights provides APM for .NET, Java, Node.js, and other runtimes. A natural choice for Azure-native workloads.
- Broadcom (formerly CA Technologies) – Offers APM capabilities through its DX Application Performance Management product, targeting large enterprise and mainframe-heavy organizations.
- BMC Software – Provides AIOps and monitoring solutions that include application performance data as part of broader IT operations management.
- IBM (Instana / Turbonomic) – IBM’s acquisition of Instana brought automated APM with continuous discovery into its observability portfolio, complemented by Turbonomic for resource optimization.
- Oracle – Oracle Application Performance Monitoring is part of Oracle Cloud Observability and Management, targeting Oracle stack workloads.
- AppNeta – Focuses on network path and application experience monitoring, useful for teams troubleshooting WAN and SaaS delivery performance.
- Riverbed Technology – Combines network performance management with APM, often used in enterprises with significant on-premises infrastructure.
APM Product Categories
APM tools are not monolithic. They differ significantly in how they instrument and analyze applications. The three primary technical approaches are:
1. Code-Based APM
Code-based APM instruments the application runtime directly, typically via agents or auto-instrumentation libraries. This approach provides the deepest visibility — method-level traces, SQL query analysis, exception tracking, and memory profiling. It is the most common approach used by Dynatrace, New Relic, and AppDynamics. OpenTelemetry has emerged as the open-source standard for instrumenting applications in a vendor-neutral way.
2. App Metrics-Based APM
Metrics-based APM collects time-series performance indicators — request rates, error rates, latency percentiles, throughput — without necessarily capturing individual traces. Tools like Prometheus combined with Grafana follow this pattern. This approach is lighter weight and scales well, but provides less granular diagnostic data than full tracing.
3. Network-Based APM
Network-based APM monitors application performance by analyzing network traffic, packet flows, and response times at the network layer. This is particularly valuable in environments where code-level agents cannot be deployed (third-party SaaS, legacy systems) or where network latency is itself a primary suspect. Riverbed and AppNeta are representative vendors in this space.
Target Industry Verticals
APM adoption is strongest in industries where application downtime or degradation has direct revenue or compliance consequences:
- Banking, Financial Services, and Insurance (BFSI) – High transaction volumes, strict SLAs, and regulatory requirements make APM essential. Trading platforms and payment gateways are particularly sensitive to latency.
- IT and Telecom – Service providers need end-to-end visibility across hybrid infrastructure to meet customer SLAs.
- Retail and E-commerce – Peak traffic events (sales, promotions) make performance monitoring critical for revenue protection.
- Healthcare – Electronic health record systems and patient-facing applications require high availability; downtime can have patient safety implications.
- Logistics and Supply Chain – Real-time tracking systems and order management platforms depend on low-latency integrations.
- Manufacturing – Industrial IoT and ERP integrations increasingly require application-level monitoring alongside OT systems.
Regional Market Dynamics
APM adoption varies by region, shaped by cloud maturity, regulatory environment, and enterprise IT spending patterns:
- North America – The largest and most mature APM market. High concentration of cloud-native organizations, large SaaS vendors, and enterprises with advanced DevOps practices drives strong demand for full-stack observability platforms.
- Europe – Growing adoption, with GDPR influencing data residency requirements for APM data collection. Germany, UK, and France are primary markets.
- Asia-Pacific – Rapid cloud adoption in China, India, Japan, and Australia is accelerating APM investment. Many organizations are adopting APM as they migrate to public cloud, bypassing some legacy tooling phases.
- Middle East, Africa, and Latin America – Earlier-stage markets with growing adoption, particularly in BFSI and telecom verticals where digital transformation investments are concentrated.
Key Evaluation Criteria for APM Tool Selection
When evaluating APM tools for your organization, DevOps and platform engineering teams should assess:
- Instrumentation overhead – What is the CPU and memory cost of the agent in production? Can it be tuned for high-throughput services?
- Language and framework support – Does the tool support your full tech stack, including any polyglot microservices?
- Kubernetes and container support – Can the tool auto-discover services in dynamic container environments without manual configuration?
- OpenTelemetry compatibility – Vendor lock-in is a real concern. Tools that accept OpenTelemetry data give you more flexibility over time.
- Pricing model – Per-host, per-agent, per-span, and per-GB pricing models all have different cost profiles at scale. Model your expected data volumes carefully.
- Alert quality and noise – Static thresholds generate alert fatigue. AI-assisted tools (Dynatrace Davis, New Relic Applied Intelligence) aim to reduce noise, but their effectiveness varies by environment.
- Integration with CI/CD pipelines – Can deployment markers be pushed automatically so you can correlate performance changes with releases?
- Data retention and compliance – Where is APM data stored? Is a self-hosted option available for sensitive environments?
The Role of Open Standards: OpenTelemetry
One of the most significant developments in the APM space in recent years is the emergence of OpenTelemetry as the CNCF-backed open standard for telemetry instrumentation. OpenTelemetry provides vendor-neutral APIs and SDKs for traces, metrics, and logs across most major languages. Virtually all major APM vendors now support ingesting OpenTelemetry data, reducing switching costs and enabling multi-vendor observability strategies.
For teams building new services, instrumenting with OpenTelemetry from the start is generally the recommended approach — it preserves optionality while delivering the telemetry data that any modern APM backend can consume.
Summary
The APM tools market encompasses a wide range of vendors, technical approaches, and deployment models. Whether you are evaluating a full-stack SaaS platform like Dynatrace or New Relic, an enterprise solution like AppDynamics, or a cloud-native stack built on OpenTelemetry with an open-source backend, understanding the tradeoffs across instrumentation depth, cost, and operational overhead is essential. The right choice depends on your stack, your team’s maturity, your compliance requirements, and your budget — not on market share reports alone.