MOTOSHARE 🚗🏍️
Turning Idle Vehicles into Shared Rides & Earnings
From Idle to Income. From Parked to Purpose.
Earn by Sharing, Ride by Renting.
Where Owners Earn, Riders Move.
Owners Earn. Riders Move. Motoshare Connects.
With Motoshare, every parked vehicle finds a purpose.
Owners earn. Renters ride.
🚀 Everyone wins.
Synthetic Monitoring – Complete Guide


1. Observability Foundation
Modern observability is not a single tool, but a stack of complementary signals:
Infrastructure + Logs + APM + Synthetic + RUM
============================================
                Alerts + Dashboards
Role of Each Signal
| Layer | Purpose |
|---|---|
| Infrastructure Monitoring | CPU, memory, disk, network, nodes |
| Log Monitoring | Errors, warnings, audit trails |
| APM | Traces, service latency, dependencies |
| Synthetic Monitoring | Proactive availability & performance checks |
| RUM (Real User Monitoring) | Actual end-user experience |
👉 Synthetic Monitoring fills the proactive gap: it tells you something is broken before real users complain.
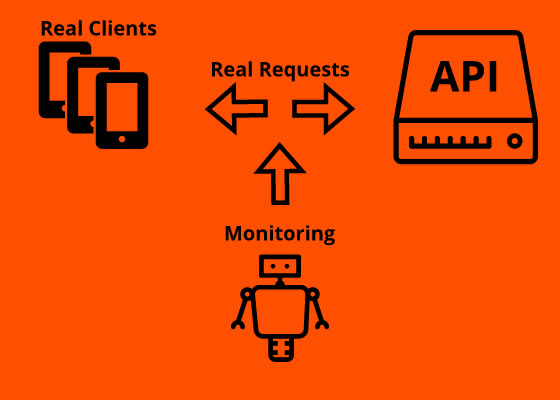
2. What Is Synthetic Monitoring?
Synthetic Monitoring is a technique where automated scripts simulate user or system behavior by sending requests to your application at regular intervals.
These scripts:
- Call endpoints
- Validate availability
- Measure performance
- Check correctness
Even if no real users are active, synthetic monitoring still runs.
3. Core Concept (From Your Notes)
SCRIPT  --->  ENDPOINT (API / HTTP / TCP / UDP)
                 |
              UP or DOWN?
Key Characteristics
- Script-driven
- Predictable execution
- Runs on schedule
- Independent of real traffic
4. What Can Synthetic Monitoring Test?
Supported Protocols
| Protocol | Use Case |
|---|---|
| HTTP / HTTPS | REST APIs, websites |
| API (REST / GraphQL) | Backend services |
| TCP | Database ports, SMTP, SSH |
| UDP | DNS, VoIP, streaming |
| ICMP | Basic reachability (ping) |
5. Types of Synthetic Monitoring
5.1 API / HTTP Synthetic Monitoring (No JavaScript)
Characteristics
- Direct HTTP calls
- JavaScript not executed
- Lightweight and fast
- Ideal for backend checks
Typical Checks
- Status code (200/201/etc.)
- Response time
- Response body validation
- Headers and auth
- TLS handshake
Example
Client (Synthetic Agent) ---> HTTP API
|
JSON Response
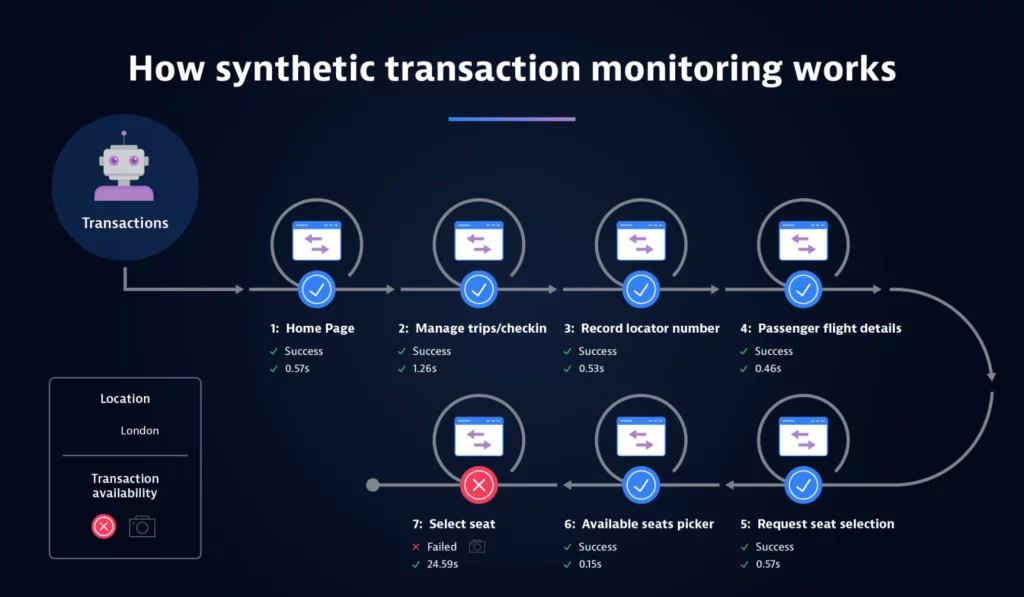
Code language: JavaScript (javascript)5.2 Browser Synthetic Monitoring (JavaScript Executed)

Characteristics
- Uses a real browser
- Executes JavaScript
- Simulates real user behavior
- Heavier than API checks
Typical Scenarios
- Login flow
- Form submission
- SPA loading (React / Angular / Vue)
- Checkout journey
Example
Synthetic Browser ---> Load HTML ---> Execute JS ---> DOM rendered
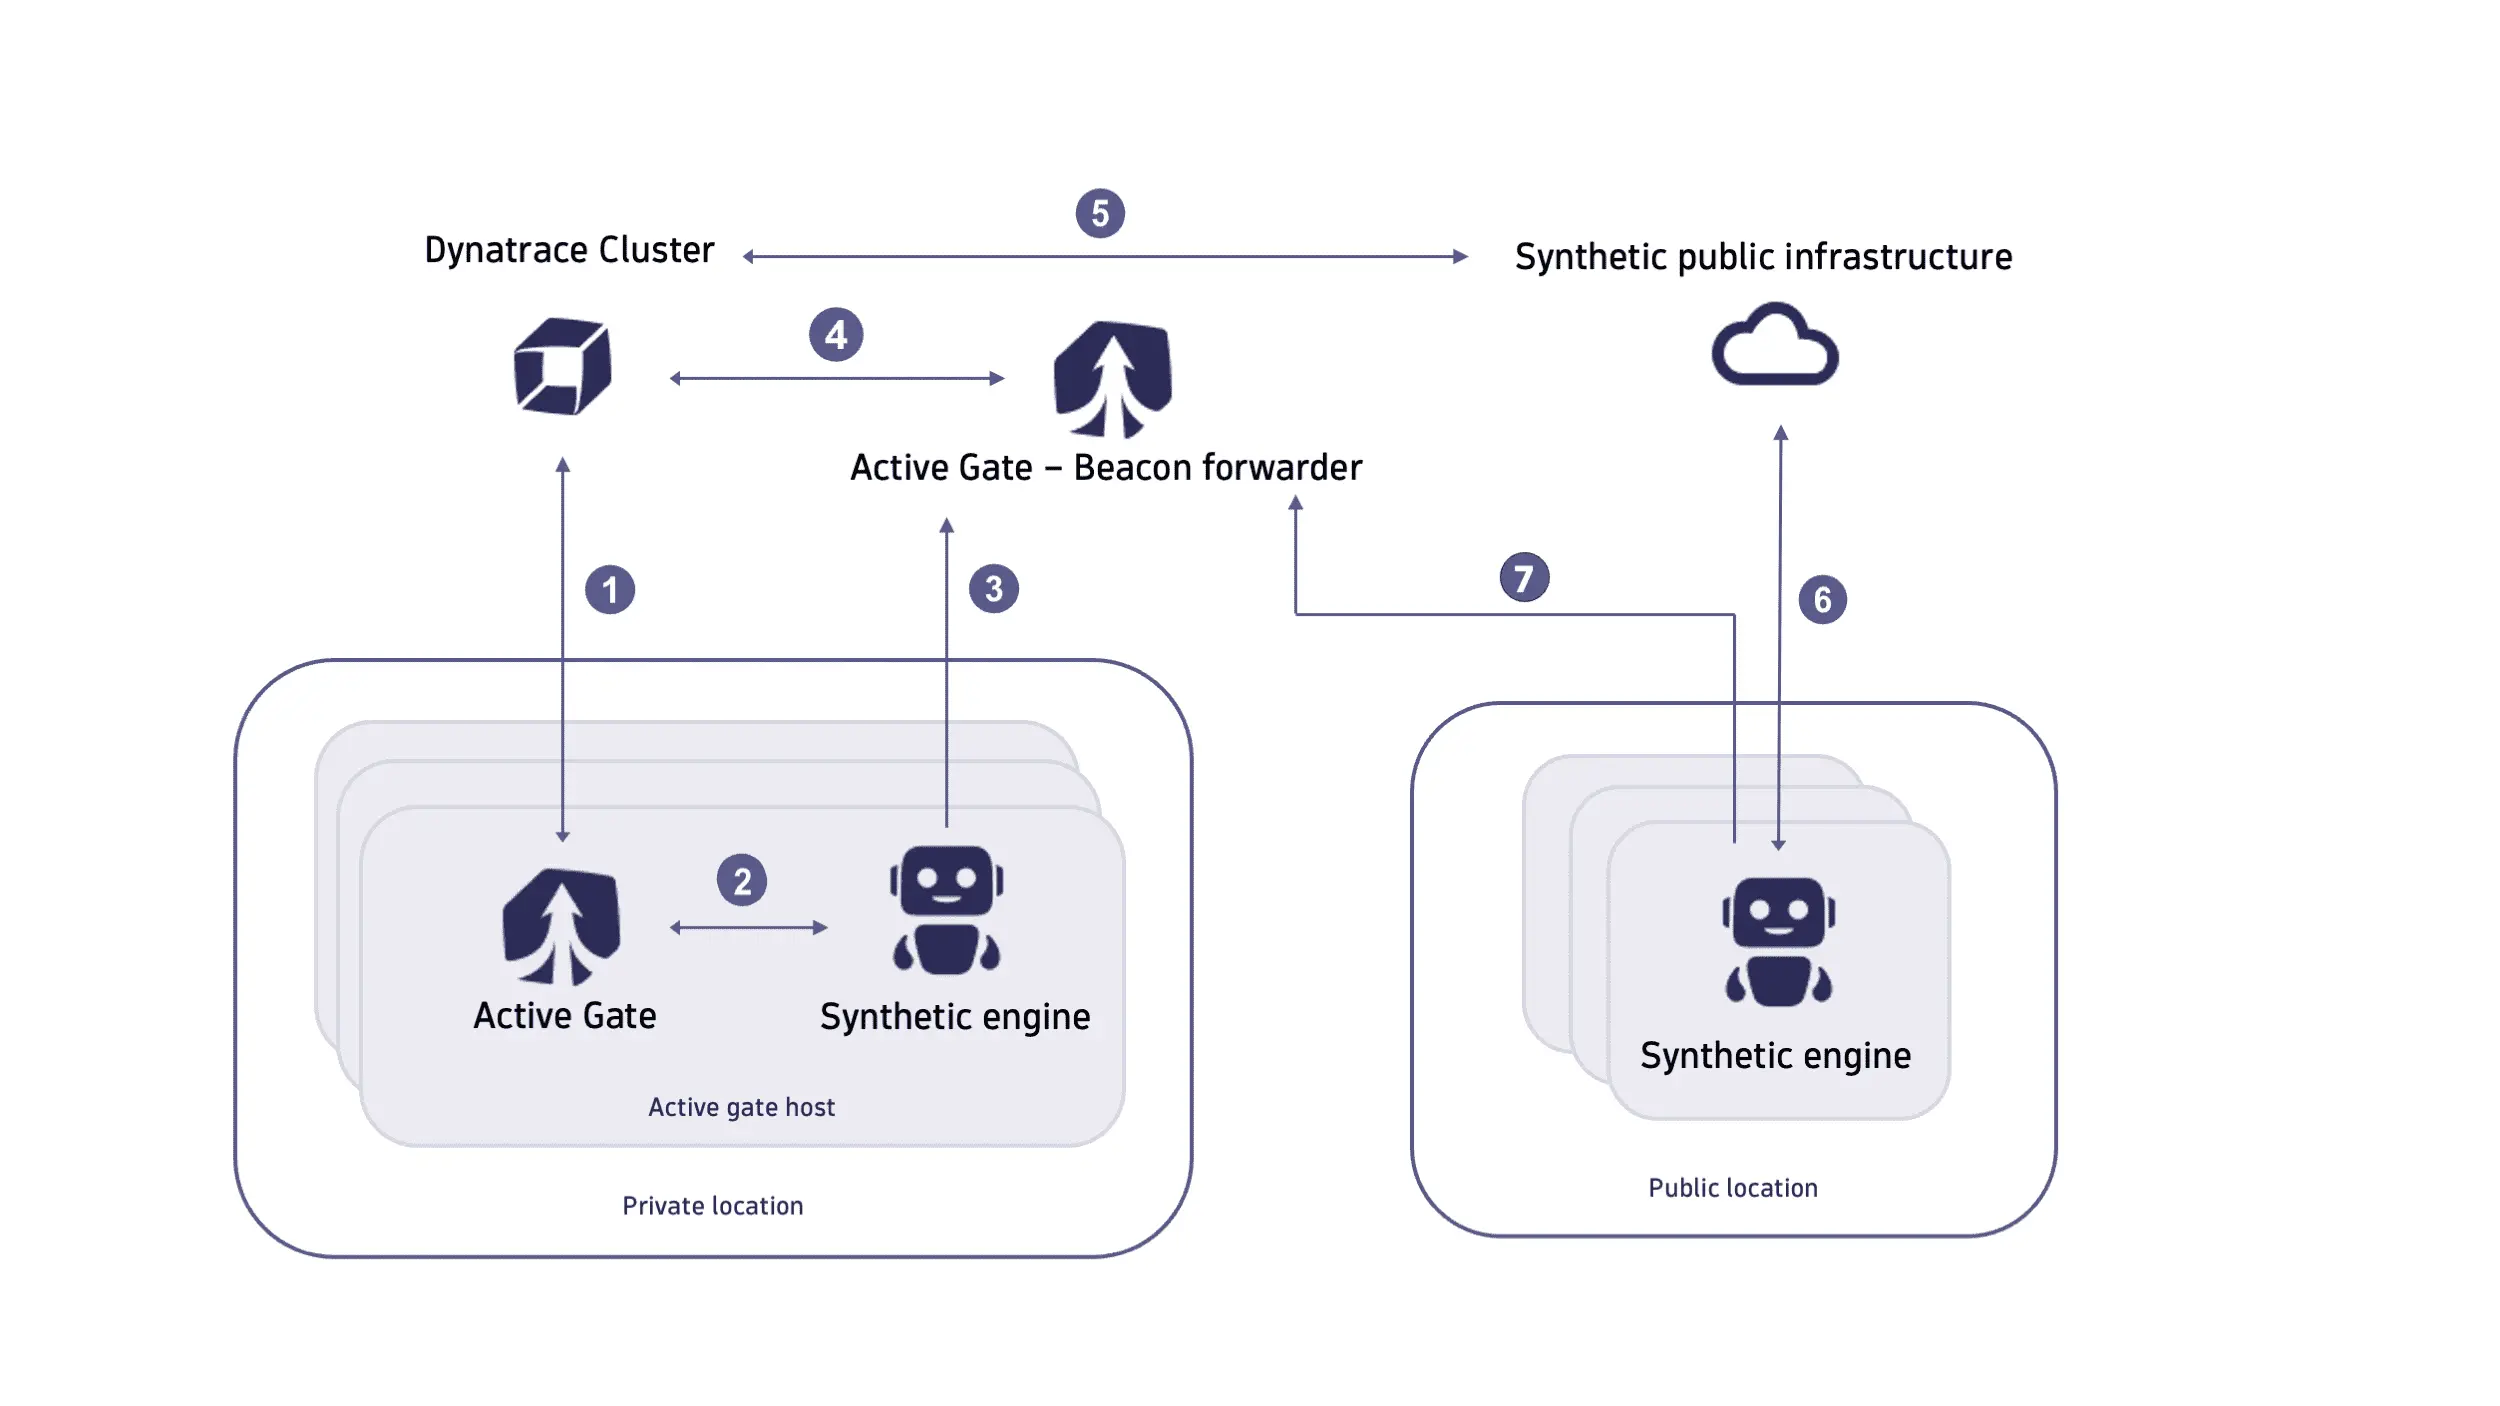
6. Where Are Synthetic Scripts Hosted?
Script Hosting Model
=============================
SCRIPT hosted by Monitoring Platform
=============================
In tools like Dynatrace, scripts are:
- Centrally managed
- Versioned
- Secure
- Executed by managed agents
7. Global Execution Locations (15+ Regions)


Scripts run from multiple geographic regions:
USA   ---> API ---> Latency / Availability
INDIA ---> API ---> Latency / Availability
EU    ---> API ---> Latency / Availability
Why Global Locations Matter
- Detect regional outages
- Measure geo-latency
- Validate CDN behavior
- Catch ISP-specific issues
8. What Exactly Is Tested in a Synthetic Request?
From your notes:
https
  protocol
  load
  auth
    pass
    cert
    token
  body
  param
Detailed Breakdown
8.1 Protocol
- HTTP / HTTPS
- TLS version
- Cipher negotiation
8.2 Load & Performance
- DNS resolution time
- TCP connect time
- TLS handshake time
- Time to first byte (TTFB)
- Total response time
8.3 Authentication
| Type | Example |
|---|---|
| Basic Auth | Username + Password |
| Token | Bearer / OAuth / JWT |
| Certificate | mTLS |
| Custom Headers | API keys |
8.4 Request Body
- JSON
- XML
- Form data
- GraphQL payload
8.5 Parameters
- Query parameters
- Path variables
- Headers
9. Availability vs Performance
Synthetic Monitoring checks both:
| Aspect | Example |
|---|---|
| Availability | Endpoint reachable? |
| Performance | Response < 500ms? |
| Correctness | JSON field exists? |
| Security | TLS valid? |
10. Alerting & Dashboards
Alert Flow
Synthetic Failure
      ↓
Alert Rule Triggered
      ↓
Notification (Slack / Email / PagerDuty)
Dashboards Show
- Uptime %
- Response time trends
- Region-wise comparison
- Failure root causes
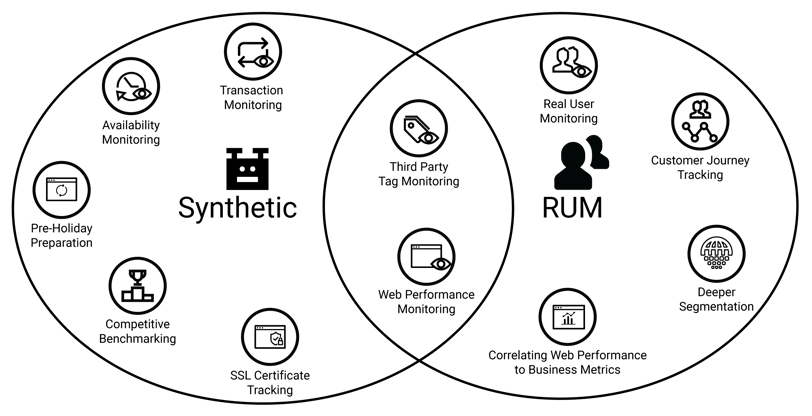
11. Synthetic vs RUM (Critical Difference)
| Synthetic Monitoring | RUM |
|---|---|
| Proactive | Reactive |
| Script-based | Real users |
| Controlled | Uncontrolled |
| Runs 24×7 | Runs when users exist |
👉 Best practice: Always use Synthetic + RUM together.
12. Common Use Cases
- API health checks
- Login page monitoring
- SSL certificate expiry checks
- Geo-availability validation
- Pre-release testing
- SLA / SLO verification
13. Best Practices
Design
- Keep scripts small and focused
- Separate API and browser checks
- Avoid unnecessary UI steps
Execution
- Run from multiple regions
- Use realistic authentication
- Set meaningful thresholds
Alerting
- Avoid alert storms
- Combine with APM context
- Alert on user-impacting failures
14. Synthetic Monitoring in Observability Strategy
Infra + Logs + APM + Synthetic + RUM
===================================
        Single Pane of Glass
Synthetic Monitoring acts as:
- Early warning system
- External viewpoint
- SLA guardian
15. Summary
Synthetic Monitoring:
- Uses scripts to test endpoints
- Works with HTTP, API, TCP, UDP
- Runs globally from managed regions
- Tests availability, performance, and correctness
- Complements APM and RUM
- Enables proactive incident detection