MOTOSHARE 🚗🏍️
Turning Idle Vehicles into Shared Rides & Earnings
From Idle to Income. From Parked to Purpose.
Earn by Sharing, Ride by Renting.
Where Owners Earn, Riders Move.
Owners Earn. Riders Move. Motoshare Connects.
With Motoshare, every parked vehicle finds a purpose.
Owners earn. Renters ride.
🚀 Everyone wins.
1️⃣ What is Prometheus?
Prometheus is an open-source monitoring and alerting system designed primarily for cloud-native and Kubernetes environments, but it works equally well with VMs, bare-metal servers, and applications.
Key Characteristics
- ✅ Monitoring Tool
- ✅ Database
- ✅ Time-Series Database (TSDB)
- ✅ Cloud-native & Kubernetes core component
- ✅ Written in Go
- ✅ Runs on any OS
- ✅ Pull-based architecture
- ✅ Highly scalable & reliable
2️⃣ Prometheus as a Time-Series Database
Prometheus stores data as time-series, meaning every data point is associated with a timestamp.
Time-Series Format
(timestamp, metric_name, value, labels)
Example
| Timestamp (epoch) | Metric | Value | Labels |
|---|---|---|---|
| 1700000000 | cpu_usage | 32 | name=”cpuserver1″ |
➡️ Each metric can have multiple labels, making Prometheus extremely powerful for filtering and aggregation.
3️⃣ Why Prometheus is Popular
- Designed for modern microservices
- Excellent label-based querying
- Strong Kubernetes integration
- Simple architecture (no external DB needed)
- Large exporter ecosystem
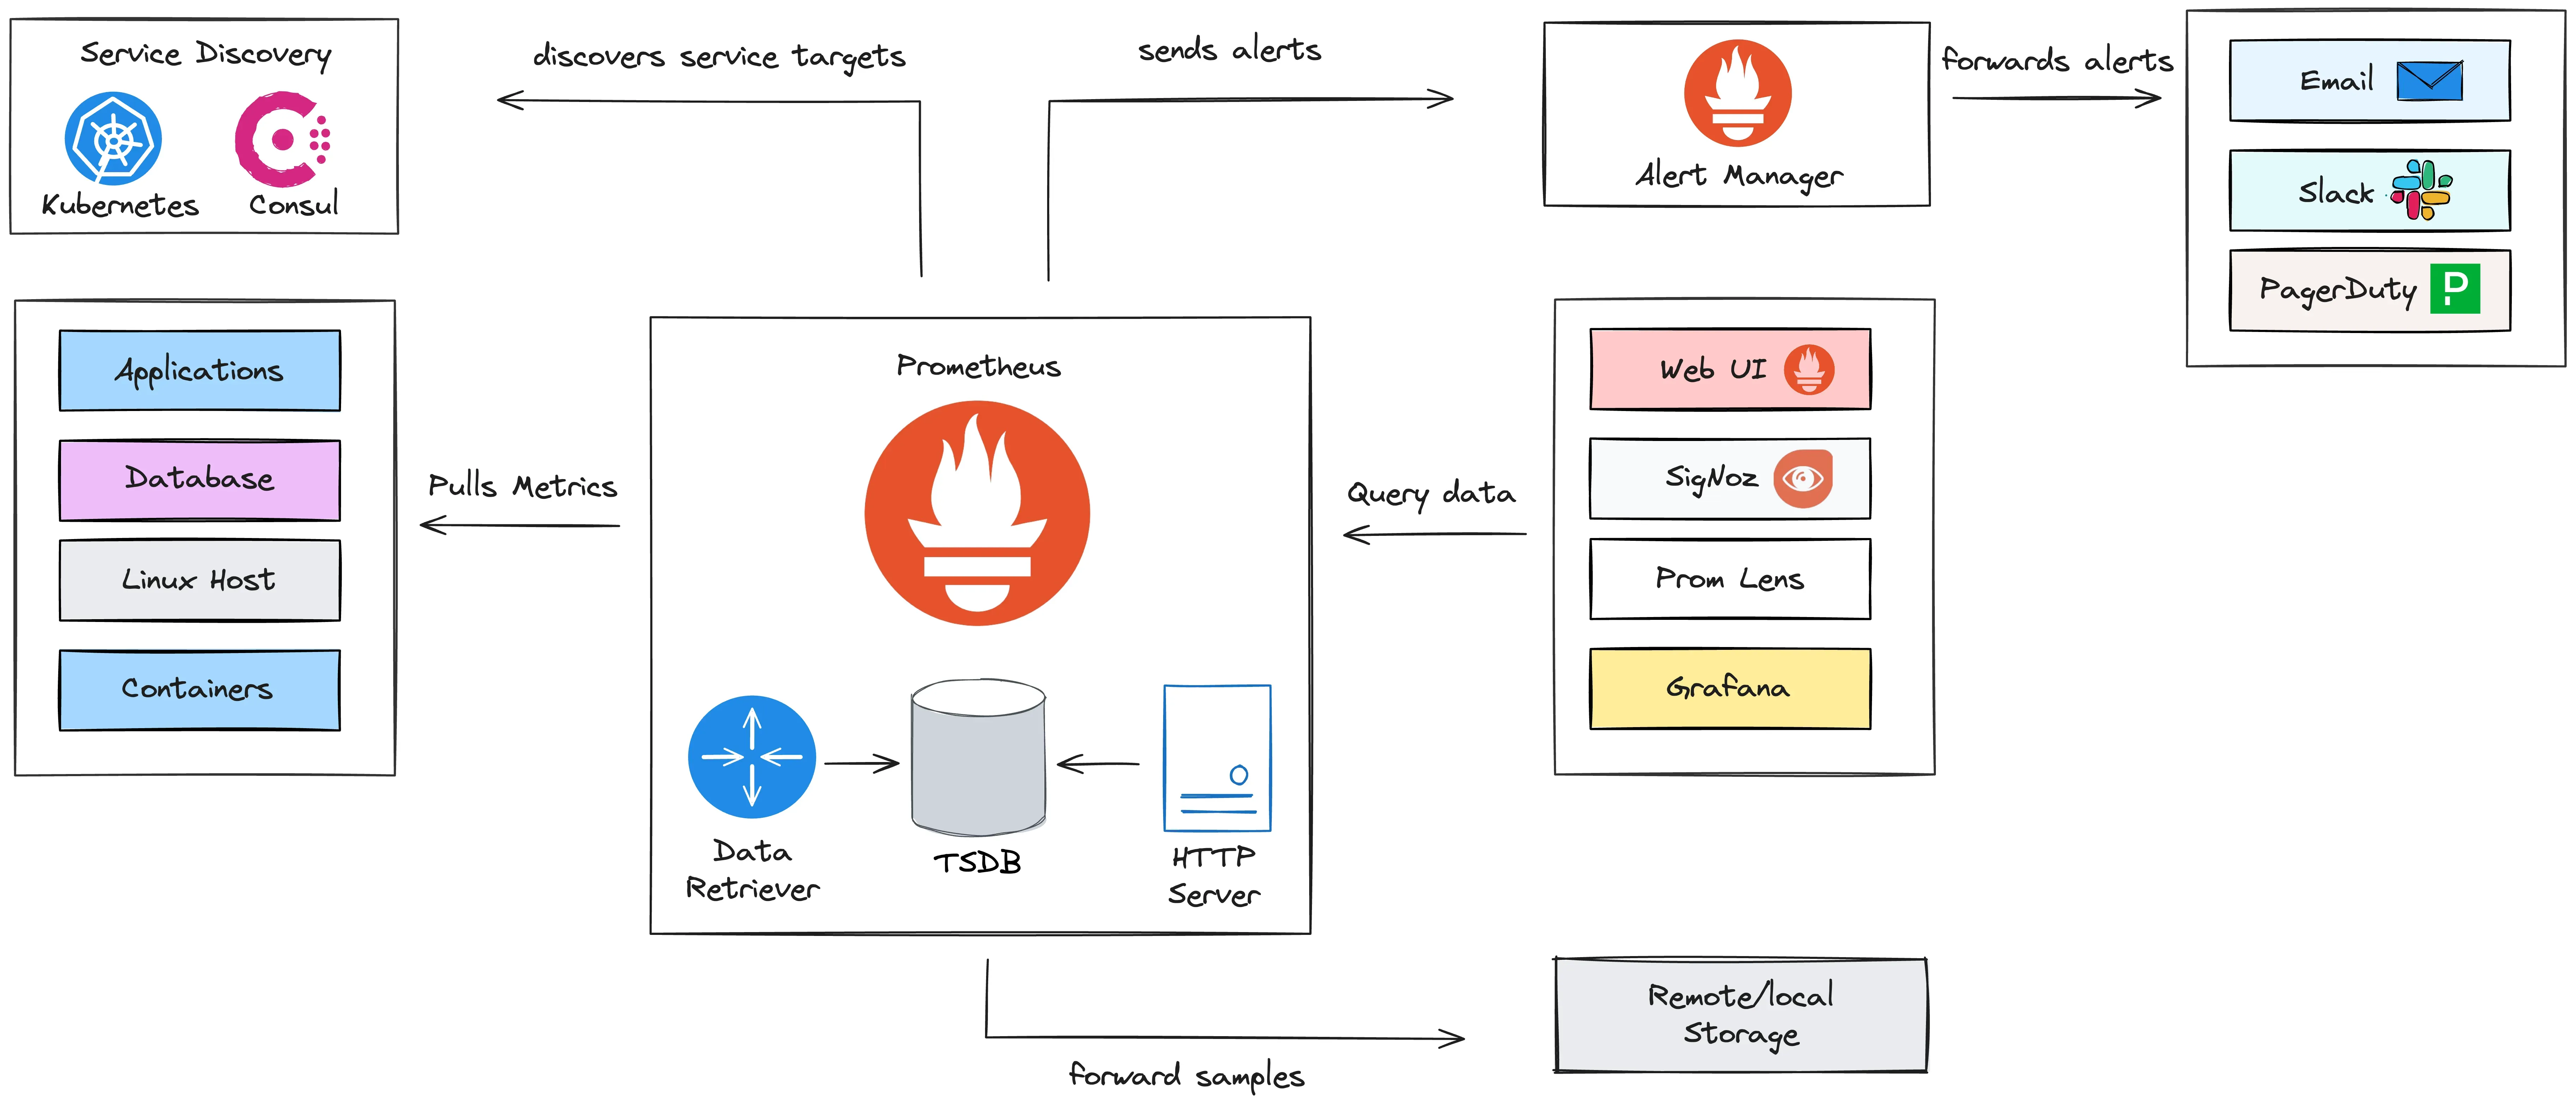
4️⃣ Architecture & Core Components of Prometheus


🔹 1. Prometheus Server
This is the heart of the system.
It includes:
- Time-Series Database (TSDB)
- PromQL Engine – query language
- Alerting Rules Engine
- Web UI (Expression Browser)
- Pull Mechanism (scrapes metrics)
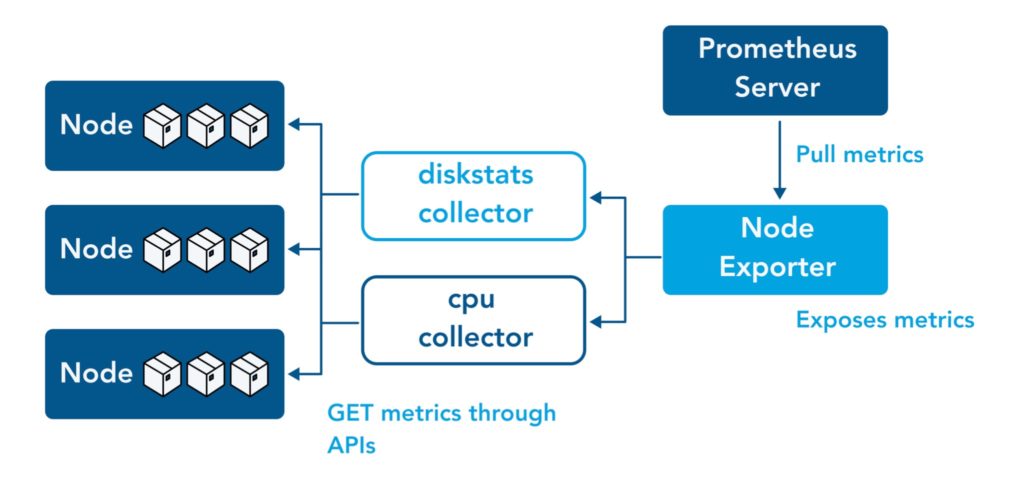
🔹 2. Exporters
Exporters expose metrics in a Prometheus-friendly format.
Examples:
- Node Exporter – Linux OS metrics
- Blackbox Exporter – HTTP, ICMP, TCP checks
- MySQL Exporter
- Nginx Exporter
📌 Exporters run on targets, not on Prometheus itself.
📘 Official exporter list:
https://prometheus.io/docs/instrumenting/exporters/
🔹 3. Client Libraries
Used when applications expose their own metrics.
Supported languages:
- Go
- Java
- Python
- Node.js
- .NET
🔹 4. Alertmanager
Handles alerts sent by Prometheus.
Functions:
- Deduplication
- Grouping
- Routing
- Notifications (Email, Slack, PagerDuty, etc.)
5️⃣ How Prometheus Works (Pull vs Push)
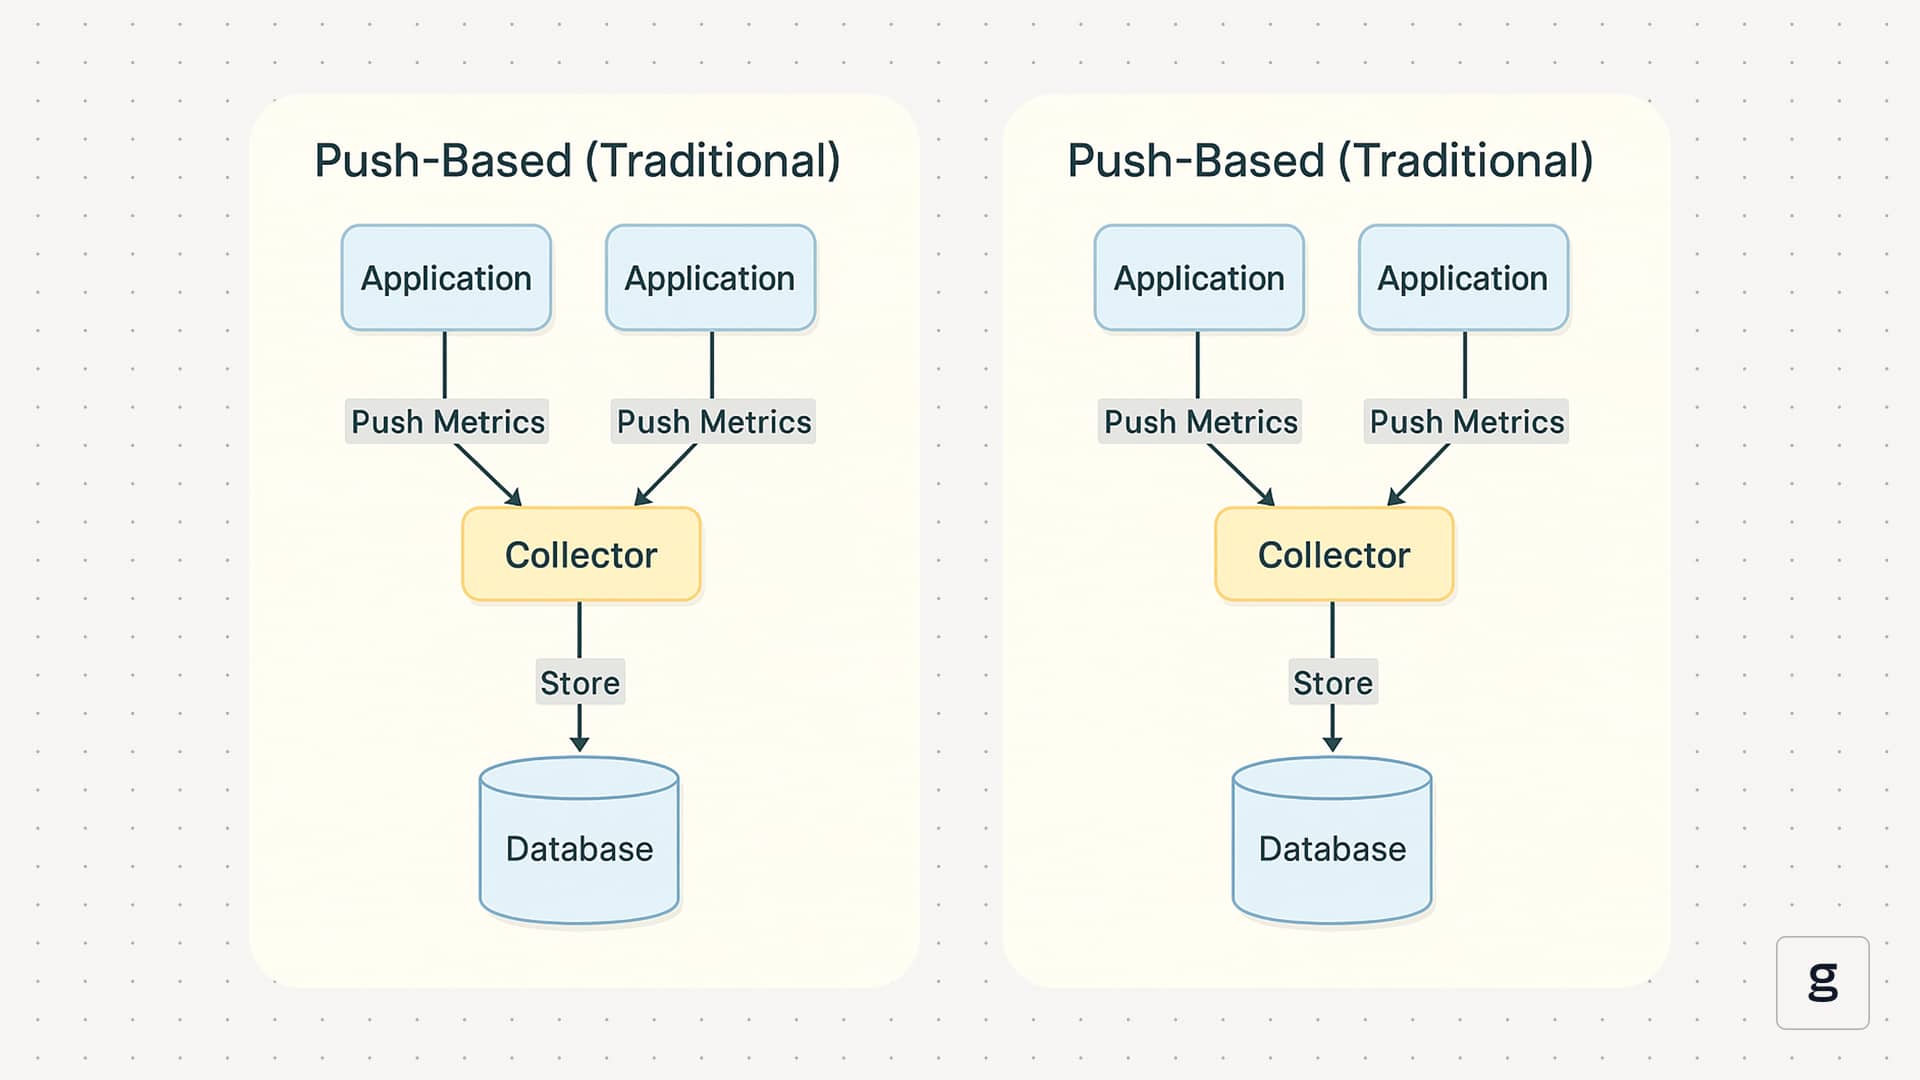
Pull-Based Model (Default)
- Prometheus pulls metrics from targets
- Targets expose
/metrics - Prometheus decides:
- When to scrape
- How often
- Which targets
✅ Better control
✅ Easier debugging
✅ Secure & scalable
⚠️ Push is only used in special cases (via Pushgateway)
6️⃣ Getting Started – Hands-On Setup
✅ Step 1: Install & Start Prometheus Server (DONE)
Download:
https://prometheus.io/download/
Reference Guide:
https://www.devopsschool.com/blog/install-and-configure-prometheus-server-and-node-exporter-in-rhel/
Access Prometheus UI:
http://43.205.98.212:9090
Code language: JavaScript (javascript)
✅ Step 2: Setup Node Exporter on Linux Servers (DONE)
Node Exporter exposes system metrics like:
- CPU
- Memory
- Disk
- Network
- Load
Example metrics endpoint:
http://43.205.98.212:9100/metrics
Code language: JavaScript (javascript)
✅ Step 3: Configure Scraping for Linux Servers
Targets:
http://43.205.98.212:9100
http://43.205.98.213:9100
http://43.205.98.214:9100
Code language: JavaScript (javascript)
🔧 Add Linux Job in prometheus.yml
scrape_configs:
  - job_name: "linux-nodes"
    static_configs:
      - targets:
          - "43.205.98.212:9100"
          - "43.205.98.213:9100"
          - "43.205.98.214:9100"
        labels:
          env: "production"
          role: "linux-server"
Code language: CSS (css)
Reload Prometheus:
kill -HUP <prometheus_pid>
Code language: HTML, XML (xml)
or restart service.
✅ Step 4: Visualize Metrics Using Expression Browser
Open:
http://43.205.98.212:9090
Code language: JavaScript (javascript)
Example PromQL Queries
CPU Usage
rate(node_cpu_seconds_total{mode!="idle"}[5m])
Code language: JavaScript (javascript)
Memory Usage
node_memory_MemAvailable_bytes
Disk Usage
node_filesystem_avail_bytes
📘 PromQL Examples:
- https://www.devopsschool.com/blog/prometheus-promql-example-query/
- https://www.devopsschool.com/blog/prometheus-promql-example-query-node-exporter/
7️⃣ Summary – Prometheus at a Glance
| Feature | Description |
|---|---|
| Storage | Built-in Time-Series DB |
| Data Model | Metric + Labels |
| Collection | Pull-based |
| Query Language | PromQL |
| Visualization | Built-in UI + Grafana |
| Alerts | Prometheus + Alertmanager |
| Cloud Native | Kubernetes native |
8️⃣ What to Learn Next 🚀
- PromQL (Advanced queries)
- Alert Rules & Alertmanager
- Grafana Dashboards
- Prometheus in Kubernetes
- Federation & Remote Storage