Prometheus:
Prometheus is an open-source systems monitoring and alerting toolkit.
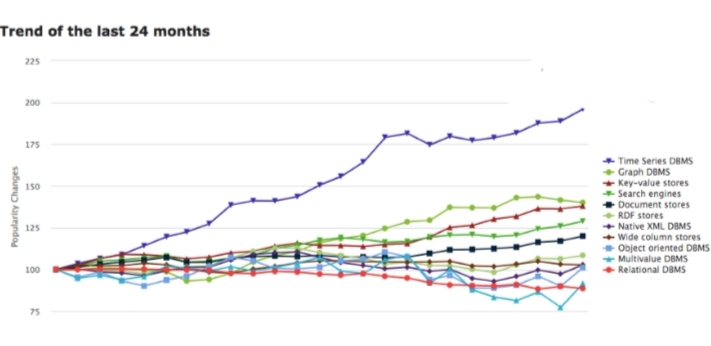
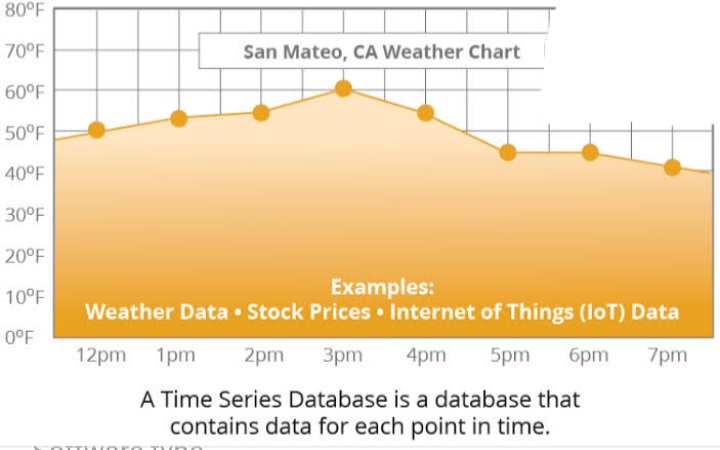
Time Series Database
Time series data is the sequence of data points collected at a regular intervals over a period of time (metrics). For eg:- device data, weather data, etc. The data require aggregation and analysis.
How prometheus is good for time series metrix?
Prometheus is a very good tool for processing and monitoring time series data. This versatile tool can be used with Graphana, a statistics visualization, and anomaly observation tool. This tool can collect data from highly loaded servers, various IoT devices, complex data processing systems, and many more.
What are components of prometheus?
1.Exporters : Exporters enable you to collect data from services and components that you cannot add direct instrumentation to because you do not have code access—for example, databases, OS kernels, routers, or cloud resources
2.Service discovery : Prometheus enables us to both statically configure metrics targets and to locate targets dynamically through service-discovery mechanisms.
3.Scraping : In Prometheus, scraping is the actual process of collecting metrics from endpoints. This is accomplished when Prometheus’ data retrieval worker sends a scrape request via HTTP.
4.Storage : Prometheus includes persistent storage on a local, on-disk time-series database. You can also integrate it with remote storage via remote read/write APIs.
How Prometheus works?
Prometheus scrapes metrics from instrumented jobs, either directly or via an intermediary push gateway for short-lived jobs. It stores all scraped samples locally and runs rules over this data to either aggregate and record new time series from existing data or generate alerts.