What is Pandas?

Pandas is an open-source Python library that provides data manipulation and analysis tools for working with structured data. It’s built on top of the NumPy library and is widely used in data science, data analysis, and data manipulation tasks. Pandas is designed to handle and manipulate data in a way that is similar to working with databases or spreadsheet software, making it a powerful tool for data preprocessing, cleaning, exploration, and transformation.
What is top use cases of Pandas?
Here are some of the top use cases of Pandas:
- Data cleaning: Pandas can be used to clean data by removing duplicates, filling in missing values, and transforming data types.
- Data analysis: Pandas can be used to analyze data by performing tasks such as:
- Slicing and subsetting: Pandas makes it easy to slice and subset DataFrames and Series.
- Merging and joining: Pandas makes it easy to merge and join DataFrames.
- Aggregation: Pandas provides a number of functions for aggregating data, such as: sum(), mean(), and median().
- Visualization: Pandas can be used to create a variety of visualizations, such as bar charts, line charts, and pie charts.
- Machine learning: Pandas can be used to prepare data for machine learning algorithms.
- Data science: Pandas is a popular library for data science, and it can be used for a variety of data science tasks.
- Finance: Pandas can be used to analyze financial data, such as stock prices and market trends.
- Logistics: Pandas can be used to analyze logistics data, such as shipping data and inventory data.
- Healthcare: Pandas can be used to analyze healthcare data, such as patient data and medical research data.
What are feature of Pandas?
Pandas is a powerful and versatile library that provides a number of features for data manipulation and analysis.
Here are some of the key features of Pandas:
- Data structures: Pandas provides two main data structures: the DataFrame and the Series. The data frame is a tabular data structure that can be used to store and manipulate multidimensional data. The Series is a one-dimensional data structure that can be used to store and manipulate array-like data.
- Data analysis: Pandas provides a number of functions for data analysis, such as:
- Slicing and subsetting: Pandas makes it easy to slice and subset DataFrames and Series.
- Merging and joining: Pandas makes it easy to merge and join DataFrames.
- Aggregation: Pandas provides a number of functions for aggregating data, such as sum(), mean(), and median().
- Visualization: Pandas can be used to create a variety of visualizations, such as bar charts, line charts, and pie charts.
- High performance: Pandas are designed to be efficient and high-performance. This makes it a good choice for working with large datasets.
- Easy to use: Pandas are relatively easy to learn and use. This makes it a good choice for beginners and experienced developers alike.
- Well-documented: Pandas are well-documented, which makes it easy to find help when you need it.
- Large community: Pandas has a large and active community, which means that there are many resources available to help you learn and use the library.
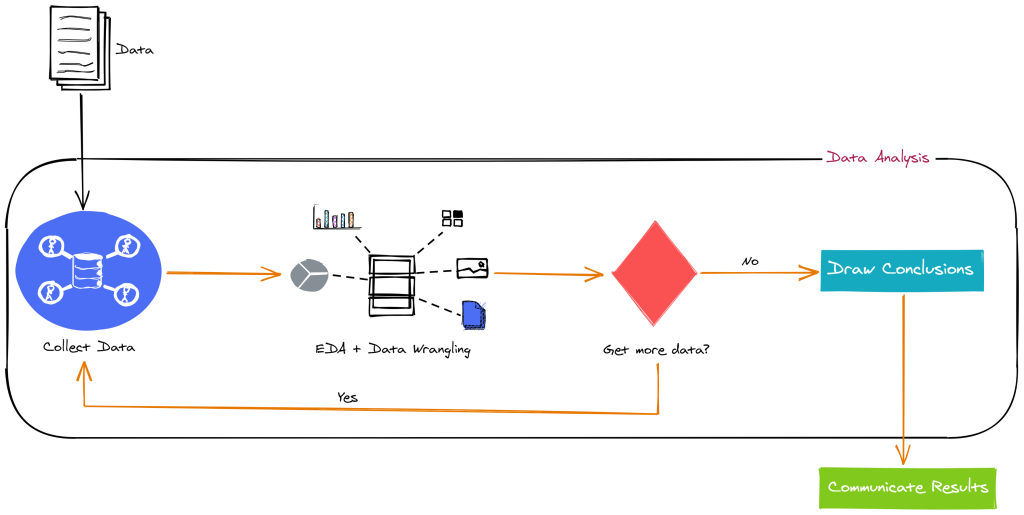
What is the workflow of Pandas?
The workflow of Pandas can be broken down into the following steps:
1. Import the library: The first step is to import the Pandas library into your Python script. You can do this by using the following import statement:
Python
import pandas as pdCode language: JavaScript (javascript)
2. Load the data: Once you have imported the library, you need to load the data that you want to work with. You can do this by using the read_csv() function. For example, if you have a CSV file called my_data.csv, you can load it into a DataFrame by using the following code:
Python
df = pd.read_csv('my_data.csv')Code language: JavaScript (javascript)
3. Explore the data: Once you have loaded the data, you need to explore it to get a sense of what it contains. You can do this by using a variety of Pandas functions, such as head(), tail(), and describe(). For example, the following code will print the first five rows of the DataFrame:
Python
df.head()Code language: CSS (css)
4. Clean the data: If the data is not clean, you need to clean it before you can analyze it. This may involve removing duplicate rows, filling in missing values, and transforming data types.
5. Analyze the data: Once the data is clean, you can start to analyze it. You can use a variety of Pandas functions to perform data analysis tasks, such as slicing and subsetting, merging and joining, and aggregation.
6. Visualize the data: Once you have analyzed the data, you can visualize it to communicate your findings to others. Pandas can be used to create a variety of visualizations, such as bar charts, line charts, and pie charts.
7. Save the data: Once you are finished with your analysis, you can save the data to a file. You can do this by using the to_csv() function. For example, the following code will save the DataFrame to a CSV file called my_output.csv:
Python
df.to_csv('my_output.csv')Code language: JavaScript (javascript)
This is just a general overview of the workflow of Pandas. The specific steps that you need to take will vary depending on your specific data and analysis needs.
How Pandas Works & Architecture?
Pandas is a Python library that provides high-performance, easy-to-use data structures and data analysis tools. It is built on top of the NumPy library, and it makes it easy to work with tabular, multidimensional, and time series data. Pandas works by providing two main data structures: the DataFrame and the Series. The DataFrame is a tabular data structure that can be used to store and manipulate multidimensional data. The Series is a one-dimensional data structure that can be used to store and manipulate array-like data.
Pandas also provides a number of functions for data analysis, such as slicing and subsetting, merging and joining, and aggregation. These functions make it easy to perform common data analysis tasks, such as finding the mean, median, and standard deviation of a DataFrame. Pandas is designed to be efficient and high-performance. This makes it a good choice for working with large datasets. Pandas is also easy to learn and use, which makes it a good choice for beginners and experienced developers alike.
The architecture of Pandas is divided into two main parts: the core and the extensions. The core provides the basic data structures and data analysis tools. The extensions provide additional functionality, such as plotting and machine learning. The core of Pandas is written in C++, which makes it efficient and high-performance. The extensions are written in Python, which makes them easy to use and extend. Pandas is a powerful and versatile library that is well-suited for a wide range of data analysis tasks. It is a good choice for beginners and experienced developers alike.
How to Install and Configure Pandas?
Installing and configuring Pandas is a straightforward process. Here’s how you can install Pandas and get started using it:
1. Install Pandas:
Pandas can be installed using the Python package manager, pip. Open your terminal or command prompt and run the following command:
pip install pandasIf you’re using Python 3, you might need to use pip3 instead of pip.
2. Verify Installation:
After installation, you can verify that Pandas is installed by opening a Python interpreter or a Jupyter Notebook and trying to import the library:
import pandas as pdCode language: JavaScript (javascript)If no errors occur, the installation was successful.
3. Start Using Pandas:
You’re now ready to start using Pandas in your Python scripts or notebooks. You can load data, manipulate it, perform analysis, and more using Pandas’ functions and methods.
Here’s a simple example to get you started:
import pandas as pd

# Create a dictionary of data
data = {'Name': ['Alice', 'Bob', 'Charlie'],
        'Age': [25, 30, 22]}

# Create a DataFrame from the dictionary
df = pd.DataFrame(data)

# Display the DataFrame
print(df)
Code language: PHP (php)
4. Configuration (Optional):
Pandas doesn’t require extensive configuration to get started. However, you might want to customize certain behaviors according to your preferences. Some common configuration options you might consider include:
- Changing the maximum number of rows and columns displayed when printing DataFrames:
pd.set_option('display.max_rows', 10)
pd.set_option('display.max_columns', 5)Code language: JavaScript (javascript)- Changing the display precision for floating-point numbers:
pd.set_option('display.precision', 2)Code language: JavaScript (javascript)- Changing the default plotting backend (e.g., Matplotlib or Plotly):
pd.set_option('plotting.backend', 'matplotlib')Code language: JavaScript (javascript)These configurations can be set at the beginning of your script or notebook to affect the behavior of Pandas throughout your analysis.
[…] Fundamental Tutorials of Pandas […]