Source:-https://devops.com/
Incentives are mismatched among SREs, SecOps, and application developers. These mismatches create challenges around how and what information is shared across siloed teams. This asymmetrical information creates a moral hazard where one team can shift deployment risk to another team, with no accountability back to the originating team. Risk shifting results in unstable applications, inefficient infrastructure, security issues and poor customer experience. All of that impacts your company’s bottom line.
Closing the Information Gap
Observability is positioned as a way to fix the information gap between these disparate groups. Observable systems allow users to ask questions about their behavior in an open-ended way, unlike more rigid monitoring systems. SREs and SecOps teams are already reaping benefits from observability, but mismatched incentives limit its effectiveness. Meeting the observability expectations of IT leaders requires pervasive instrumentation across applications, infrastructure and third-party software. Delivering that level of instrumentation has remained out of reach due to incentive mismatches, as well as human and infrastructure costs.
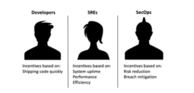
The main incentive for developers is shipping code quickly at a reasonable level of quality, meaning a low bug count. This contrasts with SREs, who are incentivized around uptime, performance and efficiency, while the incentives for SecOps teams are around risk reduction and breach mitigation.
Since SREs and SecOps teams don’t have insight into what developers have changed, it’s easy for performance or security problems to get thrown over the fence to operations. A fresh code push might only include minor changes and be harmless to existing operations. Or, it could replace large chunks of logic across the entire codebase, including adding calls to external and third-party applications. To the intrepid SRE and SecOps teams, one change looks like any other. They don’t get a peek behind the curtain because of the mismatched incentives. DevOps wants to deploy quickly. Waiting on approval from other teams slows down deployments, so comprehensive reviews don’t happen. This doesn’t mean DevOps teams are intentionally trying to sabotage partner teams. They’re simply acting in their own interests based on their incentives.
The challenge is that one party, the developers, has more information than other parties. That information asymmetry is what creates unbalanced risk sharing. Coping with information asymmetry has led to all kinds of new collaborative models, starting with DevOps and evolving into DevSecOps and other permutations like Biz DevSecOps.
True collaboration has been hard to come by. Early DevOps efforts are often successful, but scaling beyond five to seven teams is difficult because teams lack the breadth of experience in IT operations or the SRE capacity to staff multiple product teams. The change velocity DevOps teams can achieve is often far greater than SREs and SecOps can absorb, making information asymmetry worse.
If teams can’t maintain high levels of collaboration and communication, another option must be developed. Observability practices, like collecting all events, metrics, traces and logs, allow SREs and SecOps teams to interrogate applications about their behavior without knowing which questions they want to ask ahead of time. However, observability only works if applications, and the infrastructure they rely on, are instrumented. This creates another problem: who does the instrumentation?
The expectation is DevOps teams embed instrumentation into their code as part of the development process. While that’s a nice idea, there are four reasons this falls short. First, the quality of instrumentation varies. Many log statements are terse and only understandable by the developer that wrote them. The message “In function xyx123!” isn’t helpful to an SRE digging into a performance problem that cropped up in the latest release.
Second, instrumentation libraries vary by implementation, giving inconsistent results across language bindings. Open Telemetry is trying to improve this, but its progress is slow and still requires developers to do more work that, if we’re honest, doesn’t benefit them; it benefits SREs and SecOps. Now we’re back to those pesky mismatched incentives and information asymmetry problems again.
The third problem with instrumentation is the volume of data. Each instrumented application can produce terabytes of data each day. When you have robust instrumentation, the amount of data can be overwhelming, and extremely costly to analyze and store.
Lastly, instrumentation is isolated to the code your team wrote. That represents a fraction of the code you rely on. Vendor-provided services and APIs remain a black box, limiting your observability into those components.
Resolving information asymmetry across teams requires two things:
Pervasive, pluggable instrumentation capabilities for all code that doesn’t require developer involvement, and
An observability pipeline to filter, redact and enrich data, then route it to your analytics platform of choice.
Pervasive Instrumentation
Operations teams need instrumentation without having to go back to developers and beg them to add it to existing code. They need to turn it on and off as needed, and they need readily consumable data. They also need every piece of data they can get, including packet payloads, insight into encrypted data and so on. This goes well beyond what’s possible with today’s instrumentation options.
AppScope, a newly released open source project, is a new take on instrumentation. AppScope interposes itself between application threads and system libraries, tracking things like file system access, network and HTTP activity, as well as CPU and process activity. It also provides payload data, and because it sits between the application and encryption libraries, it also gives access to users’ cleartext data. Because it works with any Linux binary, SREs and operations teams can instrument anything, even code they didn’t write.
Observability Pipeline
The challenge with pervasive instrumentation is dealing with all the data generated by applications. Network, file system, and other system data can easily swamp destination APM and log analytics platforms, driving up licensing and infrastructure costs. While instrumentation data is vital to rebalancing risk sharing in organizations, you need a way to manage that data intelligently to get value out of it. This is where the observability pipeline comes in.
An observability pipeline sits between the sources of observability data and its target destinations. By acting as a strategic control point, the pipeline gives users control over how data is formatted, filtered, enriched, and redacted before it is routed to one or more destinations.
Observability pipelines help SREs and operations teams deal with the flood of instrumentation data by routing low value data to low-cost storage, like S3, while higher value information lands in APM and log analytics tools. Later, if you decide you need the data stored in S3 to add more context to your analysis, you can replay it back through the pipeline and enrich your data set.
Shifting business priorities are accelerating the pace of technology deployment across organizations, and teams are pressured to deliver faster. This faster pace of delivery pushes deployment risk to operations and security teams that lack visibility into changes developers have made across complex distributed systems. This information asymmetry also increases risk to the business as applications become less predictable and reliable over time.
Traditional methods of resolving the information mismatch haven’t worked because incentives across teams aren’t aligned. Adopting pervasive instrumentation and observability practices will give SREs and operations teams critical visibility into rapidly changing application and infrastructure environments, without disrupting the developer experience and process.