
Source: Simply Wall St. Original analysis published August 27, 2019. All figures reflect data available at that date and should not be treated as current investment advice.
Overview
How far off is Nexus AG (ETR:NXU) from its intrinsic value? Using financial data available in August 2019, this analysis examines whether the stock was fairly priced by forecasting future free cash flows and discounting them back to present value using the Discounted Cash Flow (DCF) method.
A DCF is just one valuation metric among many and is not without flaws. It works on the principle that a company’s value equals the present value of all cash it will generate in the future. The math is more approachable than the jargon suggests.
Is Nexus AG Fairly Valued?
This analysis uses a 2-stage DCF model:
- Stage 1: A 10-year explicit forecast of free cash flows, using analyst estimates where available and extrapolated figures otherwise.
- Stage 2: A terminal value representing the business’s cash flows beyond the forecast period, grown at a conservative rate tied to long-run GDP/bond rate assumptions.
Companies with shrinking free cash flow are assumed to slow their rate of shrinkage over time, and companies with growing free cash flow are assumed to see growth rates decelerate — reflecting the empirical tendency for growth to moderate in earlier years more than in later years.
10-Year Free Cash Flow (FCF) Forecast
The table below shows the levered FCF projections, the source of the growth rate estimate for each year, and the present value of each cash flow discounted at 6.56%.
| 2020 | 2021 | 2022 | 2023 | 2024 | 2025 | 2026 | 2027 | 2028 | 2029 | |
|---|---|---|---|---|---|---|---|---|---|---|
| Levered FCF (€, Millions) | €21.3m | €23.3m | €20.6m | €21.8m | €21.7m | €21.7m | €21.7m | €21.7m | €21.8m | €21.8m |
| Growth Rate Estimate Source | Analyst ×4 | Analyst ×4 | Analyst ×1 | Analyst ×1 | Est @ −0.26% | Est @ −0.11% | Est @ −0.01% | Est @ 0.06% | Est @ 0.11% | Est @ 0.15% |
| Present Value (€M) Discounted @ 6.56% | €19.9m | €20.5m | €17.0m | €16.9m | €15.8m | €14.8m | €13.9m | €13.1m | €12.3m | €11.5m |
(“Est” = FCF growth rate estimated by Simply Wall St)
Present Value of 10-year Cash Flow (PVCF) = €155.8m
Terminal Value Calculation
The second stage is the Terminal Value — representing the business’s cash flows after the explicit 10-year forecast period. A conservative long-run growth rate is used, capped at (and in this case set to) the 10-year German government bond rate of 0.2%. The cost of equity used is 6.6%.
Terminal Value (TV) = FCF2029 × (1 + g) ÷ (r − g) = €22m × (1 + 0.2%) ÷ (6.6% − 0.2%) = €345m
Present Value of Terminal Value (PVTV) = TV ÷ (1 + r)10 = €345m ÷ (1 + 6.6%)10 = €182.45m
Intrinsic Value per Share
The total equity value equals the sum of the 10-year present cash flows and the discounted terminal value:
Total Equity Value = €155.8m + €182.45m = €338.26m
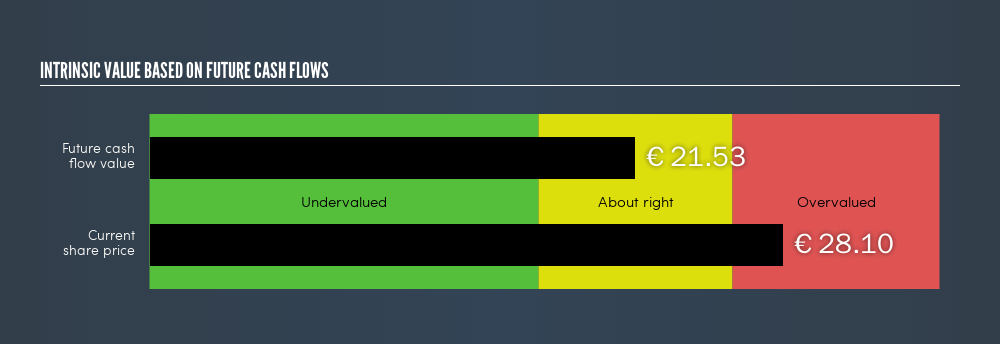
Dividing by shares outstanding yields an intrinsic value estimate of approximately €21.53 per share. Against the share price of €28.10 at the time of writing (August 2019), the stock appeared potentially overvalued — trading at a roughly 30% premium to the DCF-derived fair value estimate.
As with any DCF model, remember: garbage in, garbage out. The output is only as reliable as the inputs.
Important Assumptions and Model Limitations
The two most critical inputs to any DCF are the discount rate and the projected cash flows. Changing either meaningfully will shift the intrinsic value estimate significantly. Key assumptions used here:
- Cost of equity: 6.6% — used as the discount rate because we are evaluating Nexus from an equity investor’s perspective, not using WACC (which would account for debt).
- Levered beta: 1.063 — derived from the industry average beta of globally comparable companies, constrained to a range of 0.8–2.0 to reflect a stable business.
- Terminal growth rate: 0.2% — based on the 10-year German government bond rate at the time, a deliberately conservative assumption.
The DCF model does not account for:
- Industry cyclicality
- Future capital requirements or financing needs
- Qualitative factors such as management quality, competitive moat, or regulatory environment
If you disagree with the assumptions, running your own sensitivity analysis — varying the discount rate by ±1–2% or adjusting terminal growth — is a useful exercise to understand how robust (or fragile) the valuation is.
Next Steps: Beyond the DCF
A DCF result should be a starting point for deeper research, not a final verdict. For Nexus AG, three additional areas are worth examining:
- Financial Health: Does NXU carry a healthy balance sheet? Key checks include leverage ratios, interest coverage, and liquidity metrics.
- Future Earnings Growth: How does NXU’s projected growth compare to healthcare technology peers and the broader market? Analyst consensus estimates for upcoming years provide useful context.
- Relative Opportunities: Are there other high-quality companies in the sector that may offer a better margin of safety at current prices?
This analysis is based on data available as of August 27, 2019, sourced from Simply Wall St. It is provided for educational purposes to illustrate how a 2-stage DCF model works. It does not constitute current investment advice. Always conduct your own due diligence before making investment decisions.