Source – opsview.com
Setting up distributed network monitoring in mission critical production environments is a complex task; configuration can be challenging and mistakes costly. Opsview takes away much of the manual labor required to set-up your monitoring system with rapid Autodiscovery and REST API.
Combined with powerful network and process mapping capabilities Opsview enables you to quickly set-up your monitoring and easily see how servers, applications and services are performing.
Here’s 10 ways Opsview helps make your distributed network monitoring deployment a success:
1. Fast, easy setup and configuration
Opsview’s Autodiscovery tool, available in Opsview Pro and Opsview Enterprise, delivers rapid configuration for your monitoring system. You just need to specify an IP address or range of IP addresses to detect and Opsview will do the complex configuration work (and fast!).
Once all your devices are imported, Opsview’s configuration User Interface makes it quick and easy to get things done. Any configuration you need to make is carried out in one place, no jumping between screens or applications required. All the complex processing is kept ‘under the hood’ so you can focus on what’s important to you – configuring your monitoring environment the way you want it.
Additionally with the public REST API, included with every version of Opsview, sysadmins get full control over their Opsview configuration with the ability to use the API to automate tasks such as updating server profiles or performing reloads.
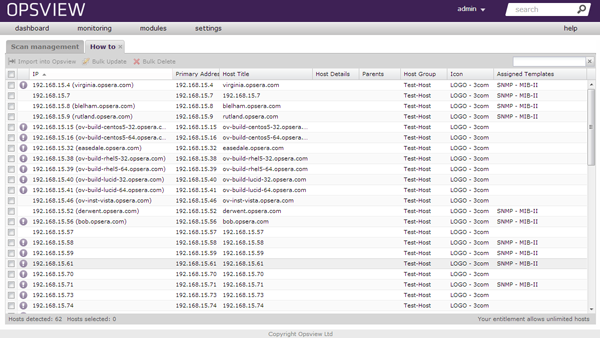
Autodiscovery IP scan in Opsview
2. Maintain consistency with host templates
Templates in Opsview can help you maintain consistent monitoring configurations throughout your system. Pre-defined templates are included for many hardware, operating systems and applications such as Cisco, Drupal CMS or the MySQL database. Any changes you make to a template will affect the whole configuration, giving you a quick way to make consistent, controlled changes to your distributed monitoring system.
3. Reduce errors with cloning
In Opsview you can quickly configure identical objects by using the clone function. In large environments chances are you will have lots of identical pieces of equipment such as network devices. Rather than having to manually enter configuration information for each one you can simply clone an existing device as many times as you need, saving time and reducing errors.
4. Speed up configurations with SNMP
Opsview’s embedded SNMP polling and trapping detects SNMP interfaces so you don’t have to. This takes away much of the time consuming configuration involved with a complex distributed network monitoring system and reduces the chances of input errors which could, in some other systems, cause a malfunction.
5. Manage complexity with attributes
Attributes In Opsview help you maintain checks on complex configurations. Instead of configuring service checks for individual hosts you can create one check and use attributes to carry out checks on each host. For example you might want a check on VMhosts which could be running 20 or 30 virtual machines. With attributes you can set up one service check on a guest VM and use attributes to reference all the virtual machines on the host. Find out more about setting up attributes in Opsview.
6. Go agentless
Opsview provides both agentless and agent-based monitoring of Windows, Linux, and Unix systems, as well as network equipment – including operating system metrics, service state, process state, file system usage, and more.
Agentless technologies like WMI and SNMP allow system administrators to deploy monitoring solutions without having to install agent software on each monitored system.
By using Opsview’s agentless monitoring capabilties administrators can see improved server, services and application availability, fast detection of server and operating system failures and reduced deployment time.
7. Get notified
Notification profiles help you keep on top of your distributed network monitoring by making sure your team get the notifications they need when they need them. You can decide who gets notified, why they get notified and how. For example you can set up your profile to get e-mail notifications during normal working hours if your system is in a warning state, but for more critical notifications, such as a system outage, an SMS can be sent to an onsite-engineer.

8. Visualize the performance of your IT
With Opsview’s process maps, network maps and host group tree maps you get powerful visualization tools that let you see how your infrastructure is performing in real-time. These tools help you understand device dependencies and relationships and see which systems may be impacted by an outage.
Creating custom maps based on your infrastructure is easy – administrators just need to upload an image into Opsview then overlay performance tags onto the map – thus highlighting the status of critical applications, infrastructures and business processes.
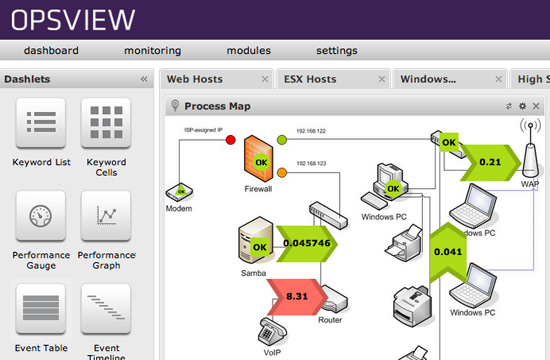
Business Process Maps in Opsview
9. Integrate with your Service Desk
Opsview’s dedicated “service desk module” allows seamless integration with helpdesk software (including Atlassian’s JIRA, ServiceNow and RequestTracker), helping to improve workflows and allowing administrators to spend less time on raising support tickets and more time on fault resolutions.
This seamless integration allows Opsview to notice an issue on a monitored system/network, for example if a critical service is no longer running or if website transaction times have breached a threshold, then automatically create and assign a ticket in the service desk system. This takes away the burden on administrators, removing the tedious task of creating and assigning support tickets.
10. Report against SLAs
Opsview Enterprise users get access to a wide range of reports ‘out of the box’, such as SLA, availability and performance reporting. These can be run manually or scheduled to be run automatically on specified days/times/dates. This gives system administrators the ability to report against specific services, applications or devices on their infrastructure and automatically email them to internal staff or customers. These reports provide insight into the overall health of your IT systems and can be used to plan for future capacity or, in the case of Service Providers, show performance against SLAs.